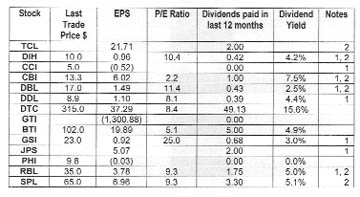
Notes
1 – Interim results
2 – Prospective
EPS: earnings per share for 12 months period to the date the latest financials have been prepared. These include:
2002 – Final results for PHI.
2005 – Final results for GTI.
2007 – Final results for DTC, BTI and SPL.
2007 – Interim results for CCI, DDL, GSI, JPS.
2008 – Interim results for TCL, DIH, CBI, DBL and RBL.
As such, some of these EPS calculations are based on un-audited figures.
P/E Ratio: Price Earnings Ratio = Last trade price / EPS
Dividend yield = dividends paid in the last 12 months/last trade price.


