The following is the first in a series of brief articles which the Stabroek Business has agreed to publish on issues pertaining to the work of the Georgetown Mayor and City Council and more particularly, to financing the work of the Council. These articles have been generated out of insights into the work supporting role being played by the Implementation Committee which has been assisting the municipality in the wake of the Report of the Commission of enquiry into the operations of the Council
Under the provisions of the Municipal and District Councils Act Chapter 28:01 of the Laws of Guyana, the Mayor and City Councillors of Georgetown are mandated to provide some key and essential services necessary for the effective management of the capital. Those services include solid waste disposal, maintenance of roads and parapets, drainage and irrigation, enforcing meat and food hygiene standards, providing public health services, maintenance of burial grounds, enforcement of city by-laws, enforcement of building codes and the management of municipal markets, street lighting, control of animals and collection of rates and taxes.
Critical to the effective functioning of the Mayor and City Council is the effective management of its financial systems and following the promulgation of the Report of the Commission of Enquiry into the operations of the City Council, an Implementation Committee has been put in place to work in close collaboration with the Council’s Finance Committee to strengthen those financial systems. One of the underlying strategies of this intervention has been to provide more credible information that can be used as a basis for establishing enhanced accounting and collection systems and provide information on a more timely basis to enable effective management decision-making.
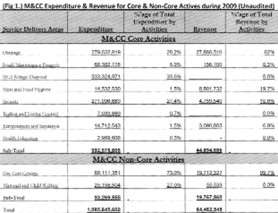
Accordingly, the Council has taken the tough but financially prudent decision to refocus its energies and resources on the provision of its core services in 2010. Part of that focus is on engaging other organizations including private sector agencies with a view to examining the possibility of outsourcing those non-core services.
The chart below illustrates the distribution of expenditure for the key areas of MCC for the year 2009.
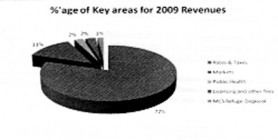
The chart below illustrates Reyenue earned by some of the key areas of MCC for the year 2009. The information shows clearly approximately 90% of the revenue is generated by Rates & Taxes collected and the Markets. This can be broken down even further to illustrate the 72% of the income being collected through Rates & Taxes.

January-May 2010
As at May 31, 2010, revenues generated by all areas within the municipality amounted to approximately $680m of which taxes and interest and taxes collected over the period amounted to 74% of total revenue. The revenue earned for the stated period amounted to 30% of the total revenue projected for the year.


