Introduction
The detailed figures presented in last Sunday’s column on Guyana’s sugar production for the years 1961 to 2010 (on the basis of 3-year averages) and the accompanying chart reveal three notable features. The first of these is that sugar production had peaked during the period 1961 to 1972. Thus for three of the 3-year average periods (1961-63; 1967-69 and 1970-72) sugar production exceeded 305,000 metric tons (tonnes). The second feature is that between 1997 and 1999 output fell to its lowest level at 153,000 tonnes or approximately one-half the level attained at peak output. The third feature is that after substantially regaining high output levels in the period 2002 to 2005, there was a consistent decline in production after 2005. Thus for the five years (2006-2010) sugar production only averaged 241,000 tonnes; this was about 50,000 tonnes below the average production for the years 2003-05.
Comparing targets with output
Over the next few columns I shall examine the factors that lie behind these observations. Before I do so readers should observe that while the annual sugar production figures reveal a trend of stagnation and decline in Guyana’s sugar industry over the past few decades; a more realistic manifestation of this stagnation and decline is gleaned by comparing the targeted levels of production set by GuySuCo’s management against the actual output attained. This comparison is particularly important as a Sugar Modernization Project has been in implementation throughout the 2000s. According to the GuySuCo website the goal of this particular project is to produce “in excess of 450,000 tonnes of sugar.” (I shall examine this project in detail later.)
 In recent months, as flagging production has become increasingly a matter of public concern, various authorities (including GuySuCo’s management and the Ministry of Agriculture), have glibly lowered the target from 450,000 tonnes to 400,000 tonnes of sugar, while offering no explanation for the substantial reduction. (see Stabroek Business, June 3). That, on a matter of such importance, this wide variation of the official industry target can be found in public documents is to my mind an indication of either the casual or manipulative manner in which the authorities treat public communications in regard to what is arguably the most important industry under public ownership and control. Of concern is the fact that the gap between both publicly stated targets (400,000 and 450,000 tonnes) and actual production remains enormous.
While the target mentioned above relates to the projected expansion of capacity based on large investments in the industry, the management of GuySuCo has also been establishing production targets for each crop year, based on its annual assessment of what should be produced, given the industry’s actual capacity and planned expenditures over the year. The variation between actual output and these annual targets also reveals the production difficulties the industry faces. The table below summarizes annual targeted and actual output data for the years 2005 to the first crop for 2011; the mean variance between the two is about 17 per cent.
Locked-in
 Readers should note that, because of high production costs over the entire period Guyana’s sugar industry (and indeed elsewhere in Caricom) could not have commercially survived without the special external marketing arrangements for sugar, which existed under the aegis of the Commonwealth Sugar Agreement (CSA) and its successor the European Commission-African Caribbean Pacific (EU-ACP) Sugar Protocol. Based on this, the reality has been that Guyana’s sugar production (and that of Caricom) has been locked-in to the sugar-refining industry of the European Union. Guyana has primarily produced ‘raw’ sugar for export sale, mainly to Europe, where refining of this (value added) takes place. Raw sugar produced for direct consumption is principally sold in Guyana and Caribbean markets.
High production costs
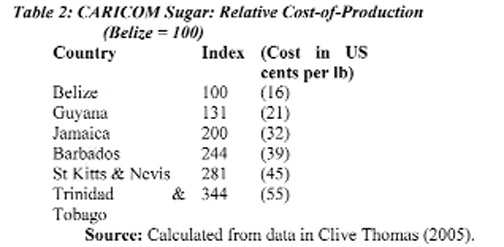
Costs of producing sugar in Guyana (and Caricom) have been well in excess of prevailing prices for sugar on the world market. For the period for which I have data, these costs have also varied enormously across the region’s sugar producers, with as I have indicated earlier Belize clearly the lowest-cost producer and Trinidad and Tobago the highest. Giving the lowest-cost producer, Belize, an index of 100, the variation in costs around the region is highlighted in the table below.
 The weighted average of the costs of production listed above is in excess of US29 cents per lb; an amount more than four times the average annual world price for Contract No 11 sugar over the comparable years.
As I continue the examination of the industry in subsequent columns it will become clear that the production and export sale of GuySuCo’s sugar has been critically dependent on the special external marketing arrangements it has had. Guyana relies only marginally on the regional and domestic market. Therein lies the dilemma the industry has faced. Once the special sugar marketing arrangements come under direct threat, the industry loses its commercial viability. The continuation of the industry in the face of this dilemma could only be based on the expectation that the industry can be modernized and its costs lowered to a level where it would be commercially competitive, even if the special marketing arrangements were substantially altered!
Next week I shall continue from this observation.