The current balance projects a surplus of $6,741 million, a decrease of $3,537 million or 34% over revised 2017. After capital receipts of $201,860 million and expenditure of $188,380 million, the plan projects an overall deficit of $54,515 million compared to a deficit of $42,444 million in 2017, 39% of which is expected to be financed by borrowings from external sources and 61% from domestic sources. Current revenue is projected to increase by $9 billion but this is offset by an increase in current expenditure of $12.3 billion. Of the current expenditure, personal emoluments account for approximately 31.3%. Debt service as a percentage of current revenue is projected at 9.4% in 2018, up from 7.9% in 2017.
The main elements of the 2018 Plan are:
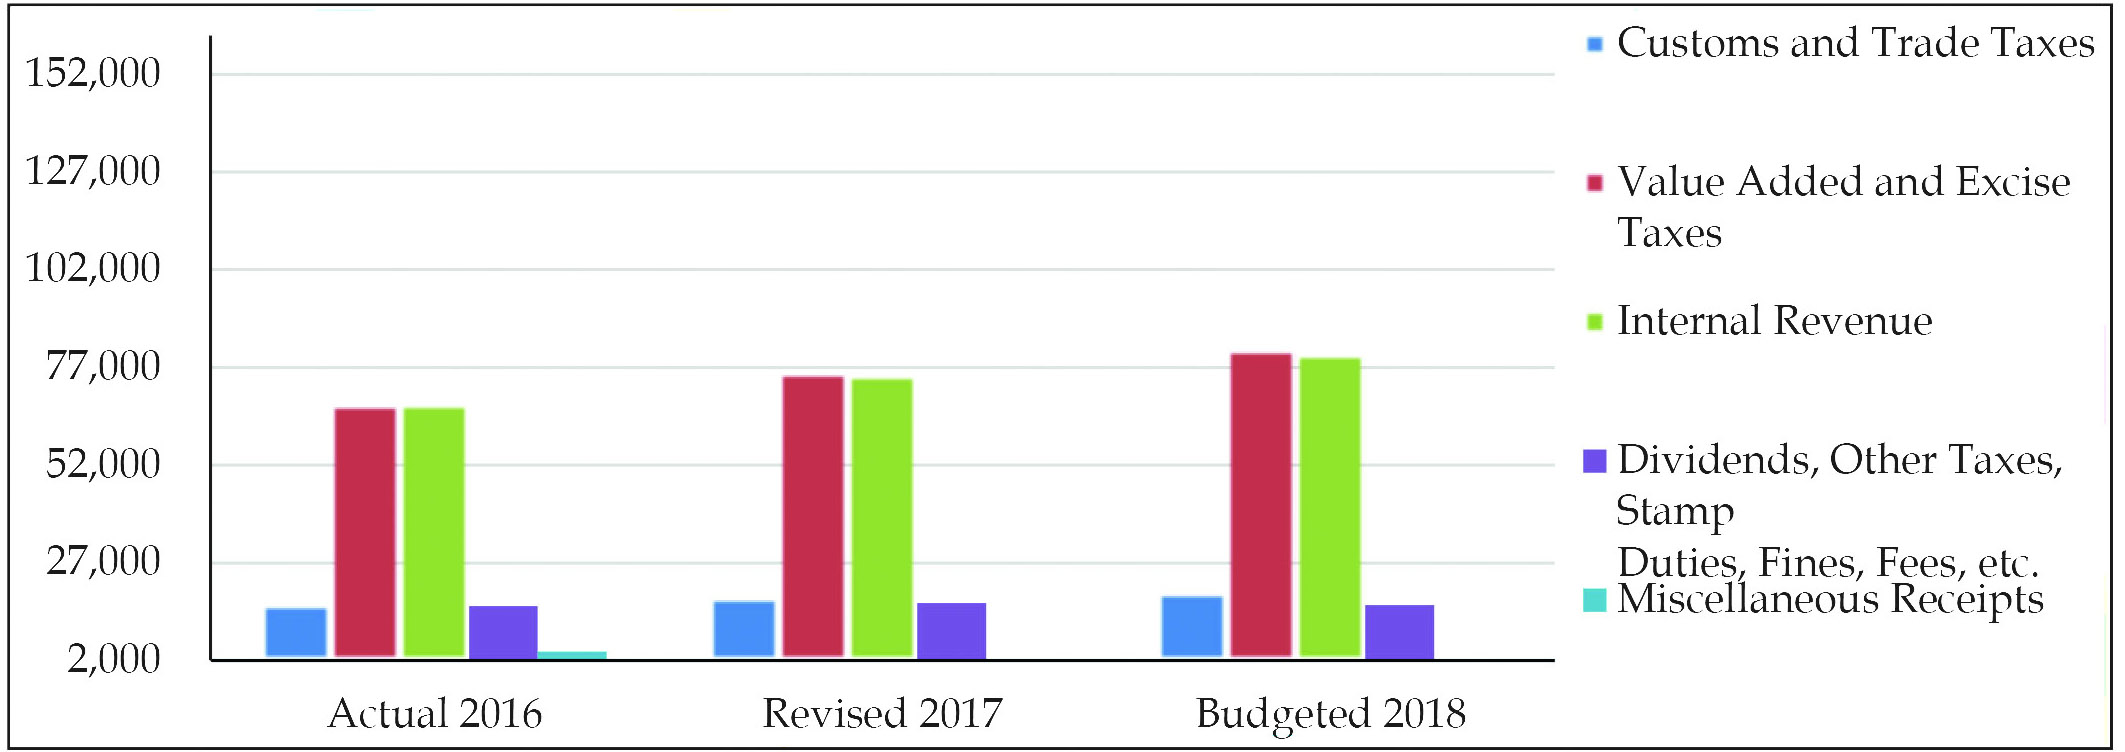
Total current revenues are projected to increase by $9,187 million to $201,860 million or by 4.8%. Of this, the Guyana Revenue Authority is expected to account for revenues of $181,371 million or 90% of total revenue, an increase of $12,289 million or 7.3% when compared to 2017.
Analysis of current revenue by type
 Source: National Estimates (G$ millions)
Of the GRA’s collections, the Internal Revenue is projected to collect $80,437 million compared with $75,153 million in 2017, a 7% increase, while Value-Added and Excise Taxes are expected to earn $81,560 million compared to $75,717 million in 2017, an increase of 7.7%. Collections by the Customs and Trade Administration are anticipated to be $19,364 million, an increase of $1,150 million or 6.3%.
VAT has transformed the tax landscape of the country and having experienced its first decline since its introduction in 2007, it is projected to increase by 6% in 2018 over 2017. VAT on domestic supplies is projected at $21,407 million while on imports, revenue of $21,637 million is budgeted. A further $121 million is budgeted to come from Miscellaneous. The composition of taxes collected by the GRA is $181,800 million and is represented by income taxes $72,001 million, companies taxes $43,408 million, self-employed persons $5,314 million, employed persons $22,923 million and other current revenue of $20,059 million.
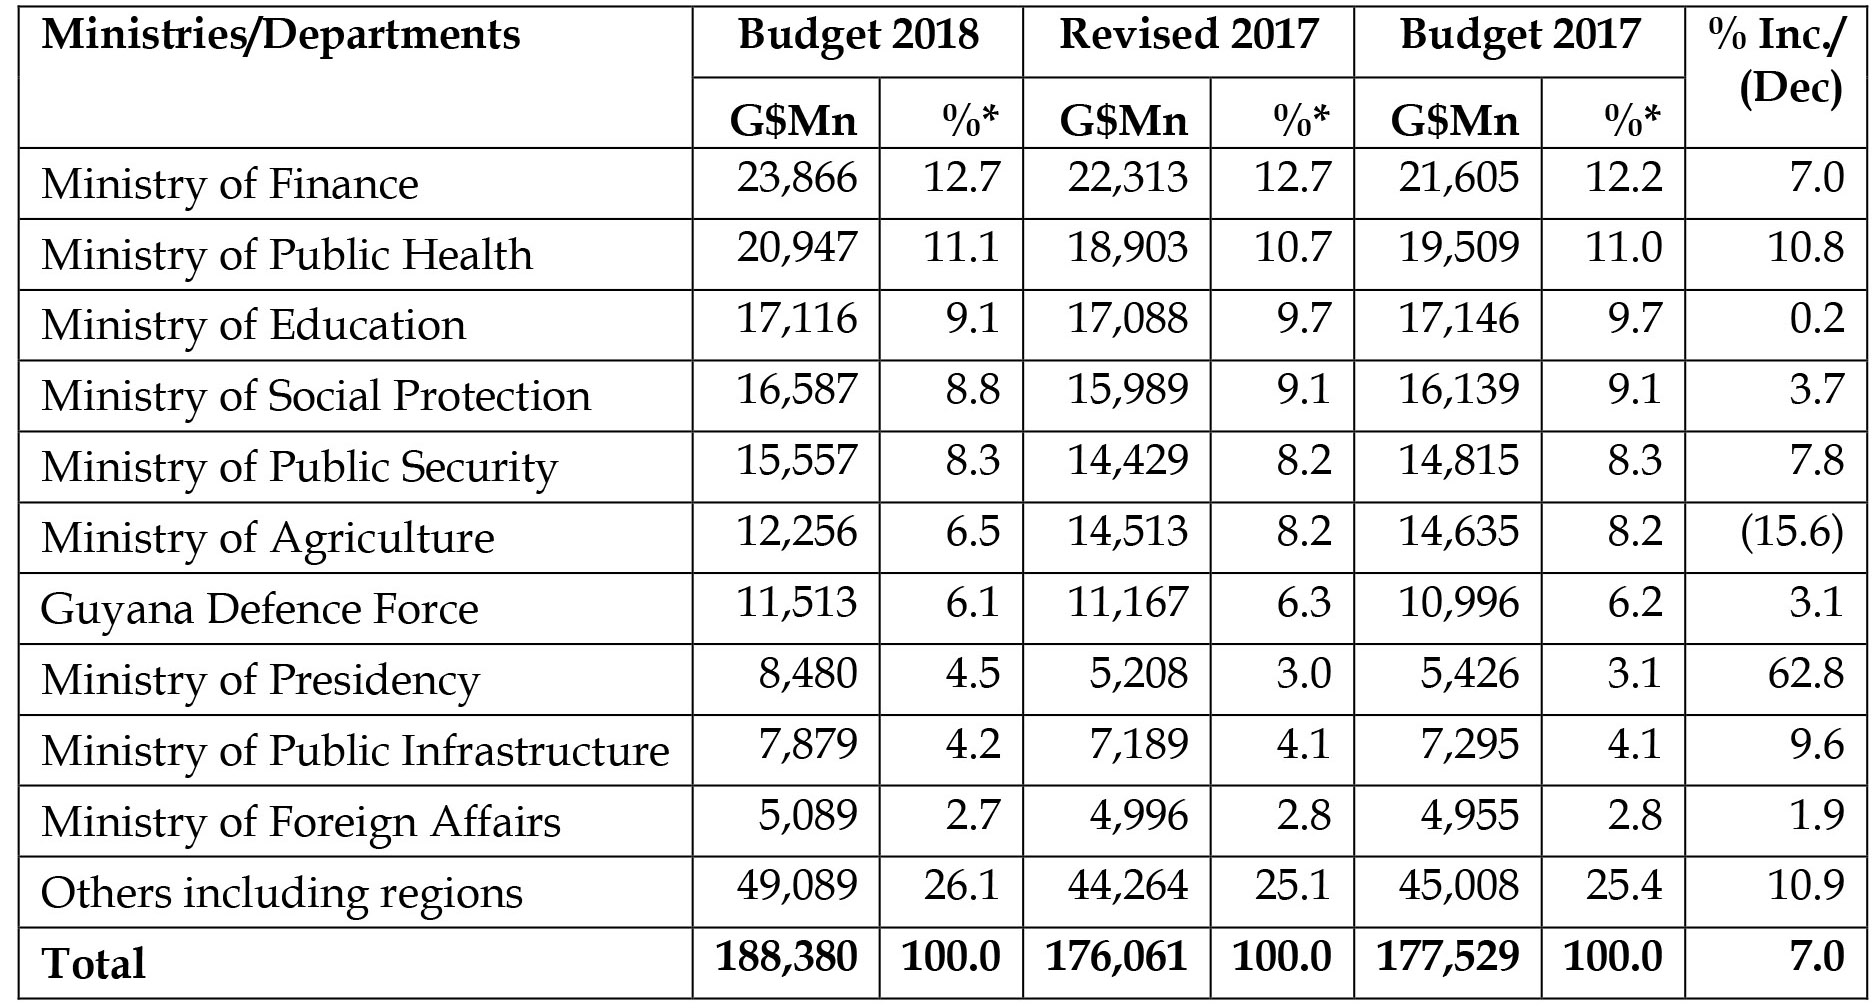
Total current non-interest expenditure is projected to increase by $12,318 million from $176,061 million to $188,380 million for 2018. Personal emoluments of $58,952 million represent an increase of 8.6% or $4,671 million over the revised figures for 2017. As a percentage of current non-interest expenditure, personnel emoluments account for 31%, Other Goods and Services 28% and Transfer Payments 41%.
Transfer payments are payments from the Government to individuals, organisations or other levels of Government made with the specific objective of furthering Government policy or programme delivery and for which the Government does not receive directly any goods or services.
Capital expenditure of $59,702 million represents a projected increase of $1,556 million or 3% over revised 2017 of $58,146 million. The top five ministries in terms of capital expenditure are:
- Ministry of Public Infrastructure;
- Ministry of Finance;
- Ministry of Agriculture;
- Ministry of the Presidency;
- Ministry of Indigenous Peoples’ Affairs.
The big ticket items of capital expenditure include:
- $24,186 million on the Ministry of Public Infrastructure programmes of which $2,000 million represents the provision of institutional strengthening and upgrading of electrification system for IDB/EU, $1,500 million for the completion and rehabilitation of Hinterland highways and roads, $1,167 million for the upgrade of the West Demerara Highway, $2,500 million for the rehabilitation of Sheriff Street – Mandela Road, $2,700 million for the provision for East Coast Demerara Highway improvements, $1,294 million for construction and completion of drains in urban areas, $1,133 million provision for Ocean Going Vessels, $5,000 million for the CJIA Modernisation Project etc.;
- $4,427 million on the Ministry of Finance of which $1,350 million represents the provision for Low Carbon Development Programme, $850 million for the provision of buildings, software, furniture and equipment for the Guyana Revenue Authority and $380 million for the final payment to the Basic Needs Trust Fund;
- $4,602 million on the Ministry of Agriculture of which $1,402 million represents the construction and rehabilitation of drainage and irrigation, $800 million for the provision of embankment, structures, pump stations and equipment for the Flood Risk Management Project, $2,071 for the allocation to the Crops and Livestock Support Services for provision of sluices, groynes, surveys and mangrove restoration etc.;
- $1,837 million on the Ministry of Presidency of which $135 million represents provision for the upgrade of geodetic infrastructure and surveys for the Land and Surveys, $114 million for the completion of buildings, purchases of vehicles and furniture and equipment, $238 million for the allocation to environmental management and compliance for EPA, National Parks Commission, Protected Areas Commission , $250 million for the cultural preservation and conservation for the Cultural Centre, Castellani House, Museum Development, National School of Dance, National Archives, National Trust and Burrowes School of Arts;
- $1,183 million on the Ministry of Indigenous Peoples’ Affairs of which $982 million represents the provision for Amerindian development programmes and projects, $140 million for the completion of dormitory and extension of buildings and $61.5 million for the provision of vehicles, boats, engines and furniture and equipment.
Interest expenditure is projected to increase by 6.4% or $406 million to $6,740 million. Domestic interest is projected to decrease by $548 million or 28%, while interest on external debt is projected to increase by $954 million or 22%.
The principal element of debt repayments is projected at $12,272 million (2017: $8,891 million), made up of domestic debt repayments of a projected $280 million (2017: $280 million), while external debt repayments are projected to increase to $11,992 million (2017: $8,611 million). During 2018, domestic and external debt service as a percentage of current revenue is projected to increase to 9.4% comparison with 7.9% for revised 2018.
The projected overall deficit of $54,515 million is expected to be financed by external borrowings of $21,103 million and from domestic sources of $33,412 million.
Ram & McRae’s Comments
- The trend of major deficit financing continues with deficits over the period 2015 actual to 2018 budgeted as follows: 2015 – $24 billion, 2016 – $38 billion, 2017 – $42.4 billion and 2018 – $54.5 billion.
- Borrowings carry a cost not only in strict financial terms but where the borrowing takes place in the domestic economy, they may crowd out borrowings by the private sector and individuals.
- Personal emoluments have increased from $31,345 million in 2011 to a projected $58,952 million in 2018, an increase of 47%. While personal emoluments have indeed been increasing by 47% between 2011 and 2017, the rate of increase is less than the increase for total current expenditures.
- The danger of deficit financing is that all things being equal, oil revenues will simply go to bridging the deficit. To the extent that some of the revenues are transferred to a Sovereign Wealth Fund, and given the fungibility of money, the Government will need to continue to borrow.
- Using the breakdown of expenditure in table 9 Abstract of Current Expenditure by Chart of Accounts in Volume 1 of the Estimates, we draw attention to the allocation of wages and salaries to various categories of employees as a percentage of total wages and salaries:
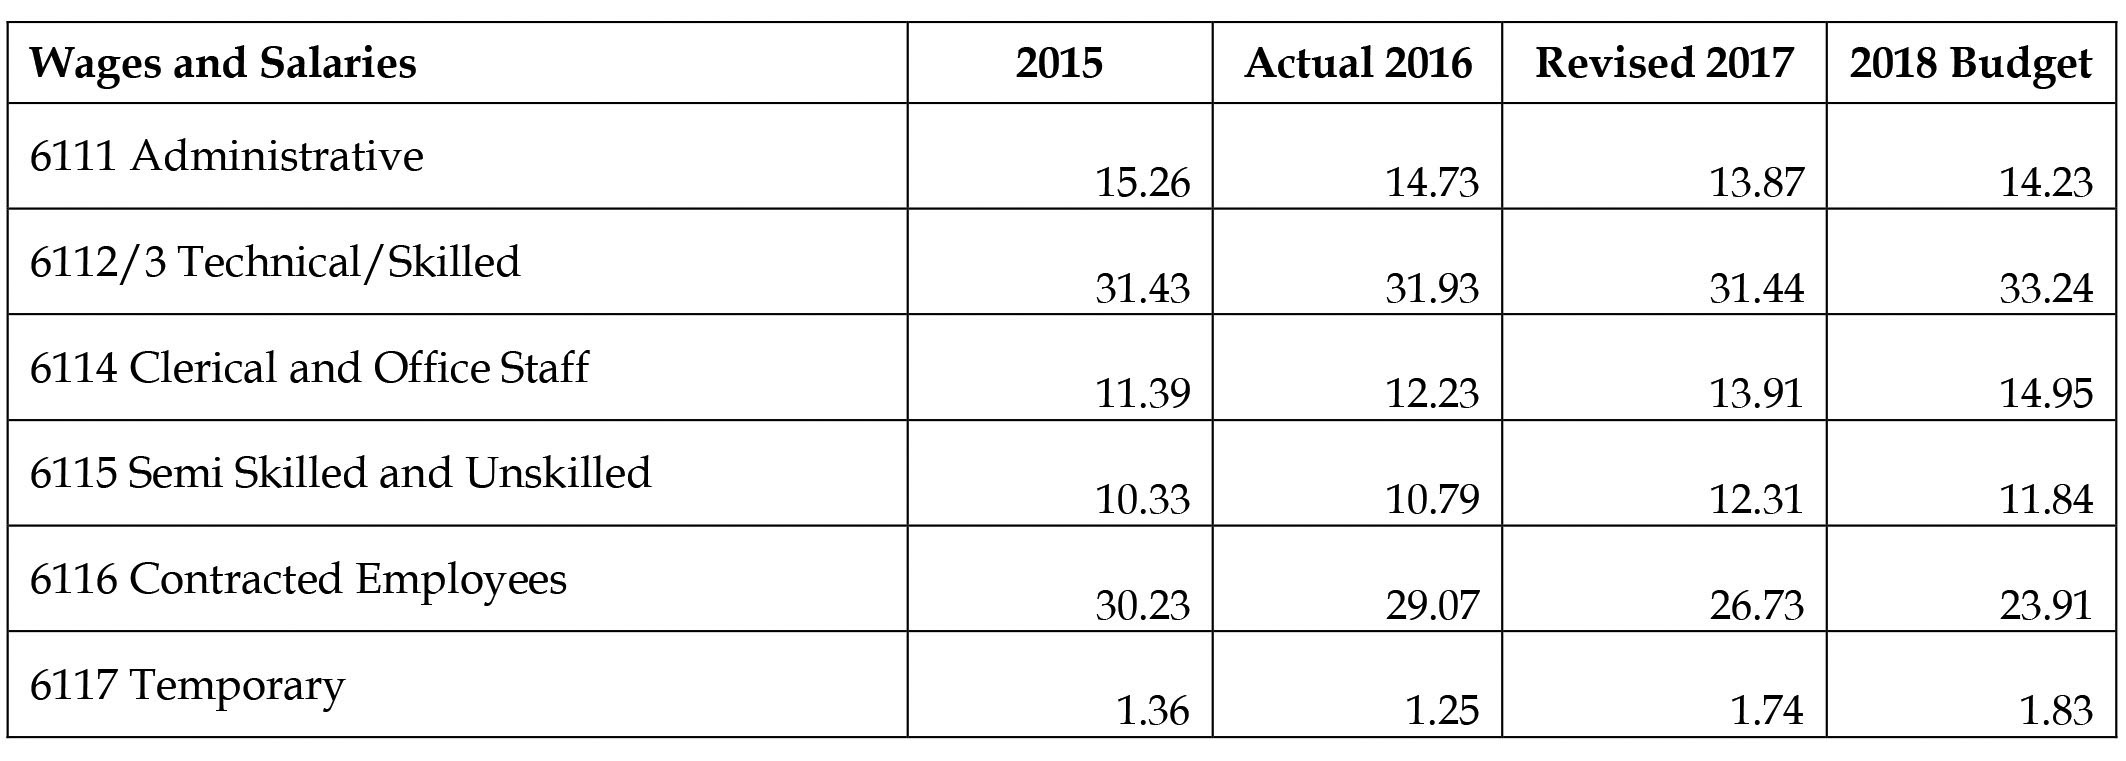 The Estimates separate the costs for administrative staff from clerical and office staff while the categories of Contracted Employees and Temporary Employees will also include clerical and administrative staff. Table 9 of the Estimates shows an abstract of current expenditure of $207.4 billion, old age pensions and social assistance account for $17.4 billion or approximately 8.4%.
Included in pension costs is an amount of $3.3 billion for Pension increases or 24% of the total pensions and social assistance budget, a sum that requires explanation given that the increase in Old Age pensions is only $500 per month or 2.6% of the amount paid in 2017.