Introduction: Findings
Today’s column addresses Part 2 of the proposed three-part evaluation of Open Oil’s financial modelling exercise of Guyana’s 2016 PSA. It presents a summary of the main Findings of that exercise. I am conscious that when doing so, this is a newspaper column designed for general readership. This suggests that most readers would be discomfited and/or intimidated by presentations, which assume much beyond middle level secondary mathematics or statistics. This judgement, I believe, is supported by the headline reporting on this modelling exercise.
Perhaps the most important finding of the financial modelling exercise is its estimation of Government take. This concept I have discussed in several recent columns, and specifically in my column of April 1, 2018. I had emphasized in that column, Government take is a “fiscal metric”, which is primarily of concern to governments. I had also posited that typically, investors focus on measures of project profitability and performance such as the internal rate of return (IRR), net present value (NPV) and the profitability ratio (PR). I had also sought to distinguish between Government take and other improved measures, such as the Effective Royalty Rate (ERR) in the April 1, 2018 column.
The financial modelling exercise has indicated that Government would receive US$7.79 billion over the life of the Liza I Stabroek field project. This take is equal to 52 percent of the positive cash flows of the project, at today’s prices. To recall, based on my formulation in the April 1, 2018 column, Contractor take (that is Exxon and partners) is equal to 1 – Government take. In this case it is 1 – 0.52 = 0.48 or 48 percent. For this formulation, Government take was defined standardly (Tordo 2007, World Bank Working Paper, 123). There it is given as “the percentage of the petroleum pre-tax project’s net cash flow adjusted to take into account any form of Government participation” (see Stabroek News, April 1, 2018). In Guyana, there is no Government participation in production and distribution.
The financial modelling exercise goes on to report: “Under any realistic scenario revenues from Stabroek will transform the Guyanan (sic) economy and public finances. Sizeable revenue will hit government accounts within two or three years of production starting in 2020”. Indeed, by 2025 these revenues could exceed this year’s budget of G$267 billion. That is rise to more than US$1.2 billion.
Related to this first finding is the second. That is, the main fiscal mechanisms (royalty and profit oil) are not progressive fiscal instruments. Indeed, they have been described as: “relatively flat”. This flatness, in turn makes for a third finding, which is such taxes are incapable of adequately capturing supernormal profits or significant economic rent accruing to the Contractor (Exxon and partners). This would be to the disadvantage of the Owner of the petroleum resources (Government of Guyana).
These three findings are derived from the “base case project” that is modelled. To remind readers that project is the Liza I, Stabroek field of 450 million barrels size, producing 100,000 barrels a day at a US$55 constant price per barrel over the project life. And, for this base case, the Contractor (Exxon and partners) is estimated to earn an IRR of between 15 ̶ 25 percent. This IRR is needed to ensure, on the one hand that increased investments continue to flow into the sector, and, on the other, untaxed supernormal profits are not flowing to the Contractor.
Model Variations
It is a practice of economic modelers to change certain variables in their models, in order to observe the impact of these changes on the Findings. Sometimes this is conducted as a purely esoteric exercise to highlight unique outcomes. I do not want to confuse readers at this stage but the modelling exercise has changed some variables in order to observe their impact on outcomes. I believe that two of the changed variables are of usefulness to lay readers. One relates to variations in the size of the “base case” oil field. And, the other, is the assumed constant price for Guyana crude oil sales.
Variation 1
The model asserts that: if the price of oil per barrel is set at US$80 (and not US$55) and the size of the field is increased from 450 million to 750 million, revenues flowing to the State would rise to US$24.76 billion and Government take could be reduced from 52 to 51 percent.
Variation 2
Further, at US$65 per barrel, which was the price ruling at the time of the exercise (mid-March) and a field size of 450 million barrels, Exxon’s IRR is 19.6 percent after tax. At a field size of 1 billion barrels, Exxon’s IRR rises rapidly to 39.7 percent.
Variation 3
Also, at the base case field size of 450 million barrels, Exxon and partners reach “maximum IRR” at a price of US$75 per barrel.
Variation 4
Finally, if the field size rises from 450 million barrels to 750 million barrels, the “maximum IRR” is reached at US$50 per barrel!
Liza I and Comparators
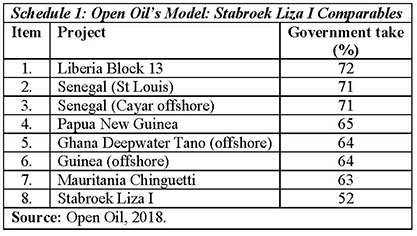
As indicated last week, the financial modeling exercise was conducted with the aim of drawing comparisons to other similar types of petroleum fields. The Report on the modelling exercise claims: “The analysis shows that Guyana’s share of profits is low, not only compared to major producers but also to terms agreed in other frontier provinces at a time when they were early stage producers”. The data that I had cited in my column of April 28, 2018 revealed that average Government take for a group of 19 countries over the period 2009 – 2014 had varied from a low of 23 percent (Poland) to a high of 88 percent (Algeria).
I’ll take up this point in the Part 3 critique of Open Oil’s evaluation. Table 1 shows the data for the comparable projects, which the financial modelling exercise identified (as revealed in last week’s column).
Conclusion
Next week I shall respond to those alleged inaccuracies which Open Oil identified, and then commence my assessment of the modelling exercise.