
Introduction
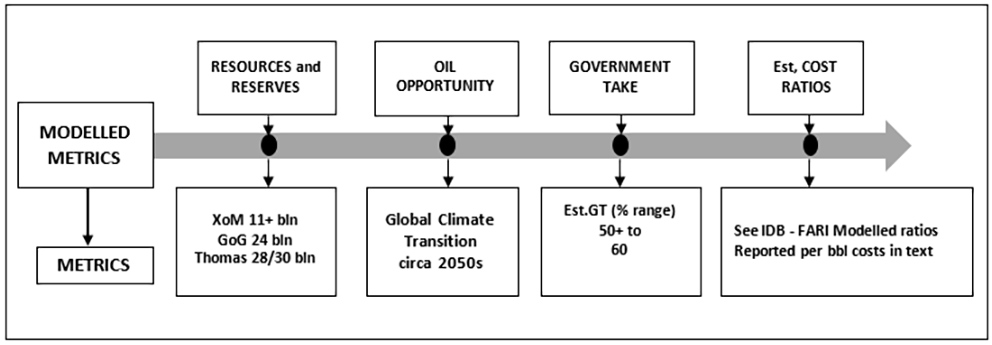
As titled, today’s column sums up my efforts since January 28 to assess the sustainability of Guyana’s oil and gas explosive growth. This determines the intrinsic affordability of the Buxton Proposal, the UBI mechanism that I recommend for Guyana to confront its embedded poverty. I argue, that in essence this is a function of four economic drivers whose metrics have been generally, already modeled. These are revealed in the text and chart below:
1. Guyana’s assessed oil and gas resources and estimated reserves,
given technology
2. Guyana’s oil opportunity as determined by the United Nations
global climate transition ambition
3. Guyana Government Take under the prevailing Production
Sharing Agreement, PSA
4. Industry estimated /modelled operating cost ratios
Chart 1, Modelled Metrics
KPI Metrics
The four listed drivers and their modeled metrics have been discussed extensively over recent weeks. I have deemed them to be, constituent components of Guyana’s emerging oil and gas sector. As such they effectively condition the growth capability of Guyana’s emerging petroleum industry. Directly and indirectly they therefore, condition, if not fix, the trajectory of Guyana as a rising Petrostate.
Metrics Key Performance Indicators, KPIs
Based on the above formulation I further advanced the proposition that, the petroleum metrics of Guyana centre on three crucial relations. These are:
First, there is the projected value of earnings, in US dollars. from Guyana petroleum sales. This value is dependent on 1) the projected petroleum reserves 2) its expected daily rate of production, DROP, expressed in barrels of oil equivalent, boe, and 3) the price at which each barrel of oil equivalent, boe, is sold. The commercial sale of gas whenever this commences.
Second, overall projected profit is earned out of petroleum sales; that is projected total profit obtained on each boe sold, is a function of the volume of sales; the price of each boe; and, the cost of production incurred in producing each boe.
The third relation is dependent on how much of the profit obtained from each boe sold is expected to flow to the Government of Guyana, GoG? As used in this series, this share of the profit is termed the Government Take or average effective tax rate, AETR, This Take is clearly determined by the fiscal terms of the various applicable Production Sharing Agreements, PSAs, governing the oil companies’ allocated successful Guyana oil blocks.
Approach
Since January I have considered the relations in the order indicated above. My concluding observations on the four drivers are summarized as follows. First, Exxon Mobil and partners have reported 11 billion barrels of oil equivalent; the Government of Guyana reported 25 billion at its recent public auction of oil blocks; I have estimated 28-30 billion barrels; while various independent estimates from specialist firms reach as much as 50 billion boe.
Second global modeling of the climate transition has, led by the United Nations, arrived at the consensus view that, today’s societies have up to the 2050s to complete the transition away from energy dependence on carbon emitting fuels.
Third, to the best of my knowledge, more than four years after Guyana’s First Oil [December 2019] I remain unable to access any calculation of the projected net cash flow share ratio undertaken by the two Principal Parties to the current Stabroek Block PSA – the Contractor [Exxon Mobil and partners] or the Government of Guyana, GoG. Over this period, I have found that only six independent measures of Government Take were completed.
The six have been conducted by three non-commercial bodies; that is Open Oil, a global NGO; the Faculty of Engineering, University of Trinidad and Tobago; and, the Inter-American Development Bank, IDB, along with two energy business intelligence and consultancy firms. These are Rystad Energy and Wood Mackenzie
As we noted, the results range from 50 plus percent, Open Oil, to 60 percent Rystad Energy.
The fourth and final driver modeled and appraised has been the cost shares of various components that make up the vey competitive cost of production in the Stabroek Block. Admittedly, the modeling exercise was completed early, year 2, in Guyana’s emerging oil and gas sector.
Conclusion
Next week I close this re-visit of the Buxton Proposal, my recommended social protection as well as the UBI mechanism required for the successful overcoming of Guyana’s persistent poverty.