 Introduction
In today’s column I commence an elaboration, in two parts, of the modeling of the petroleum metrics that undergird the Buxton Proposal. As readers are well aware, the descriptor, Buxton Proposal, has been put forward as a Universal Basic Income, UBI mechanism, which I am urging, constitutes, potentially, the most effective social protection measure for eradicating Guyana’s stubbornly embedded monetary income poverty. The two parts mentioned above, cover respectively, 1] the key drivers of Guyana’s nationally determined oil output capability and 2] their key performance indicators, KPI’s, for Guyana’s oil and gas industry.
To facilitate this two-part task, I have prepared a Template [see Schedule1 below], which lays out the modality that I intend to employ in pursuit of the first part of the two-part task referred to above. At this point, some readers might recall that I had utilized a similar Template in laying out the schema I employed for the Guyana Petroleum Road Map, which I had crafted to guide the emergence of Guyana as Americas fastest rising Petrostate.
Modeled Drivers
As presented, in the template revealed below, four drivers are listed, as key. This list is not exhaustive. Clearly others can be identified. As such therefore, the modeled drivers are constituent components or features that condition the expansion of Guyana’s emerging oil and gas industry.
Thus, to take an example the first driver listed is Guyana’s known and probable petroleum resources and reserves as defined by the Society of Petroleum Engineers, SPE. They account for 1] risk-taking [innovation and invention]; 2] knowledge [science and technology intensity]; 3] capital and finance; 4]market development [energy use]; 5] regulatory, institutional and governance as well as 6] happenstance, as I have tried to develop this concept in this ongoing series of columns.
I firmly believe however that the listed four, whether directly or indirectly; [the latter through interactions or close relations] are overwhelming in determining the trajectory of the drivers as a collective force In Guyana.
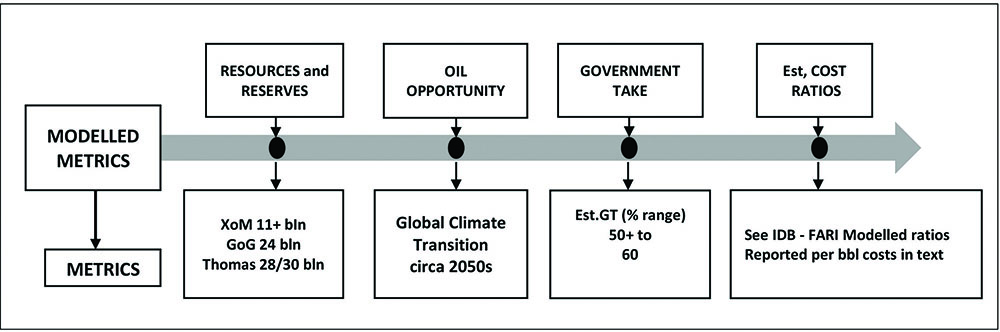
The four drivers listed in the Template are,
1. Guyana’s assessed oil and gas resources and estimated reserves, given technology
2. Guyana’s oil opportunity as determined by the United Nations global climate transition ambition
3. Guyana Government Take under prevailing Production Sharing Agreement, PSA
4. Industry estimated /modelled operating cost ratios
Schedule 1 Modelled Metrics Part 1
 KPI Metrics
Here I address the second of the Two-part metrics labelled the …, KPI’s, undergirding the Buxton Proposal.
Metrics: Key Performance Indicators, KPIs
For the second part of the two-part approach I focus on what might be inferred as insights into the affordability of the Buxton Proposal. The detailed petroleum metrics here centre on three crucial relations. These are:
First, there is the projected value of earnings, in US dollars, from Guyana petroleum sales. This value is dependent on 1) its projected petroleum reserves 2) its expected daily rate of production, DROP expressed in barrels of oil equivalent, boe, and 3) the price at which each barrel of oil equivalent, boe, is sold. The commercial sale of gas has not yet started, so gas sales are not included.
Second, overall projected profit is earned out of petroleum sales; that is projected total profit obtained on each boe sold, is a function of the volume of sales; the price of each boe; and, the cost of production incurred in producing each boe.
The third relation is dependent on how much of the profit obtained from each boe sold is expected to flow to the Government of Guyana, GoG? As used in this series, this share of the profit is termed the Government Take or average effective tax rate, AETR, This Take is clearly determined by the fiscal terms of the various applicable Production Sharing Agreements, PSAs, governing the oil companies’ allocated successful Guyana oil blocks.
Approach
Going forward, I shall summarize these three relations in the order indicated above. However, I need first to make a few observations. First, I shall present simple Schedules to elaborate these relations and my projections. Second, unless otherwise stated, my projections are based on the “full ramp-up”, level of oil and gas production, as indicated in what follows. Third, the energy … firm, Rystad Energy has modelled Guyana’s petroleum metrics/revenues; as revealed before in the Road Map. The relevant information from that model is restated, at appropriate stages below. Fourth, I have applied my values to compare with the Rystad Energy model. These values yield different outcomes.
Conclusion Real Price- adjusted BP
Six years after arriving at the UBI target set at US 5,000 dollars per annum adjustments are required. This will be addressed later.