Dear Editor,
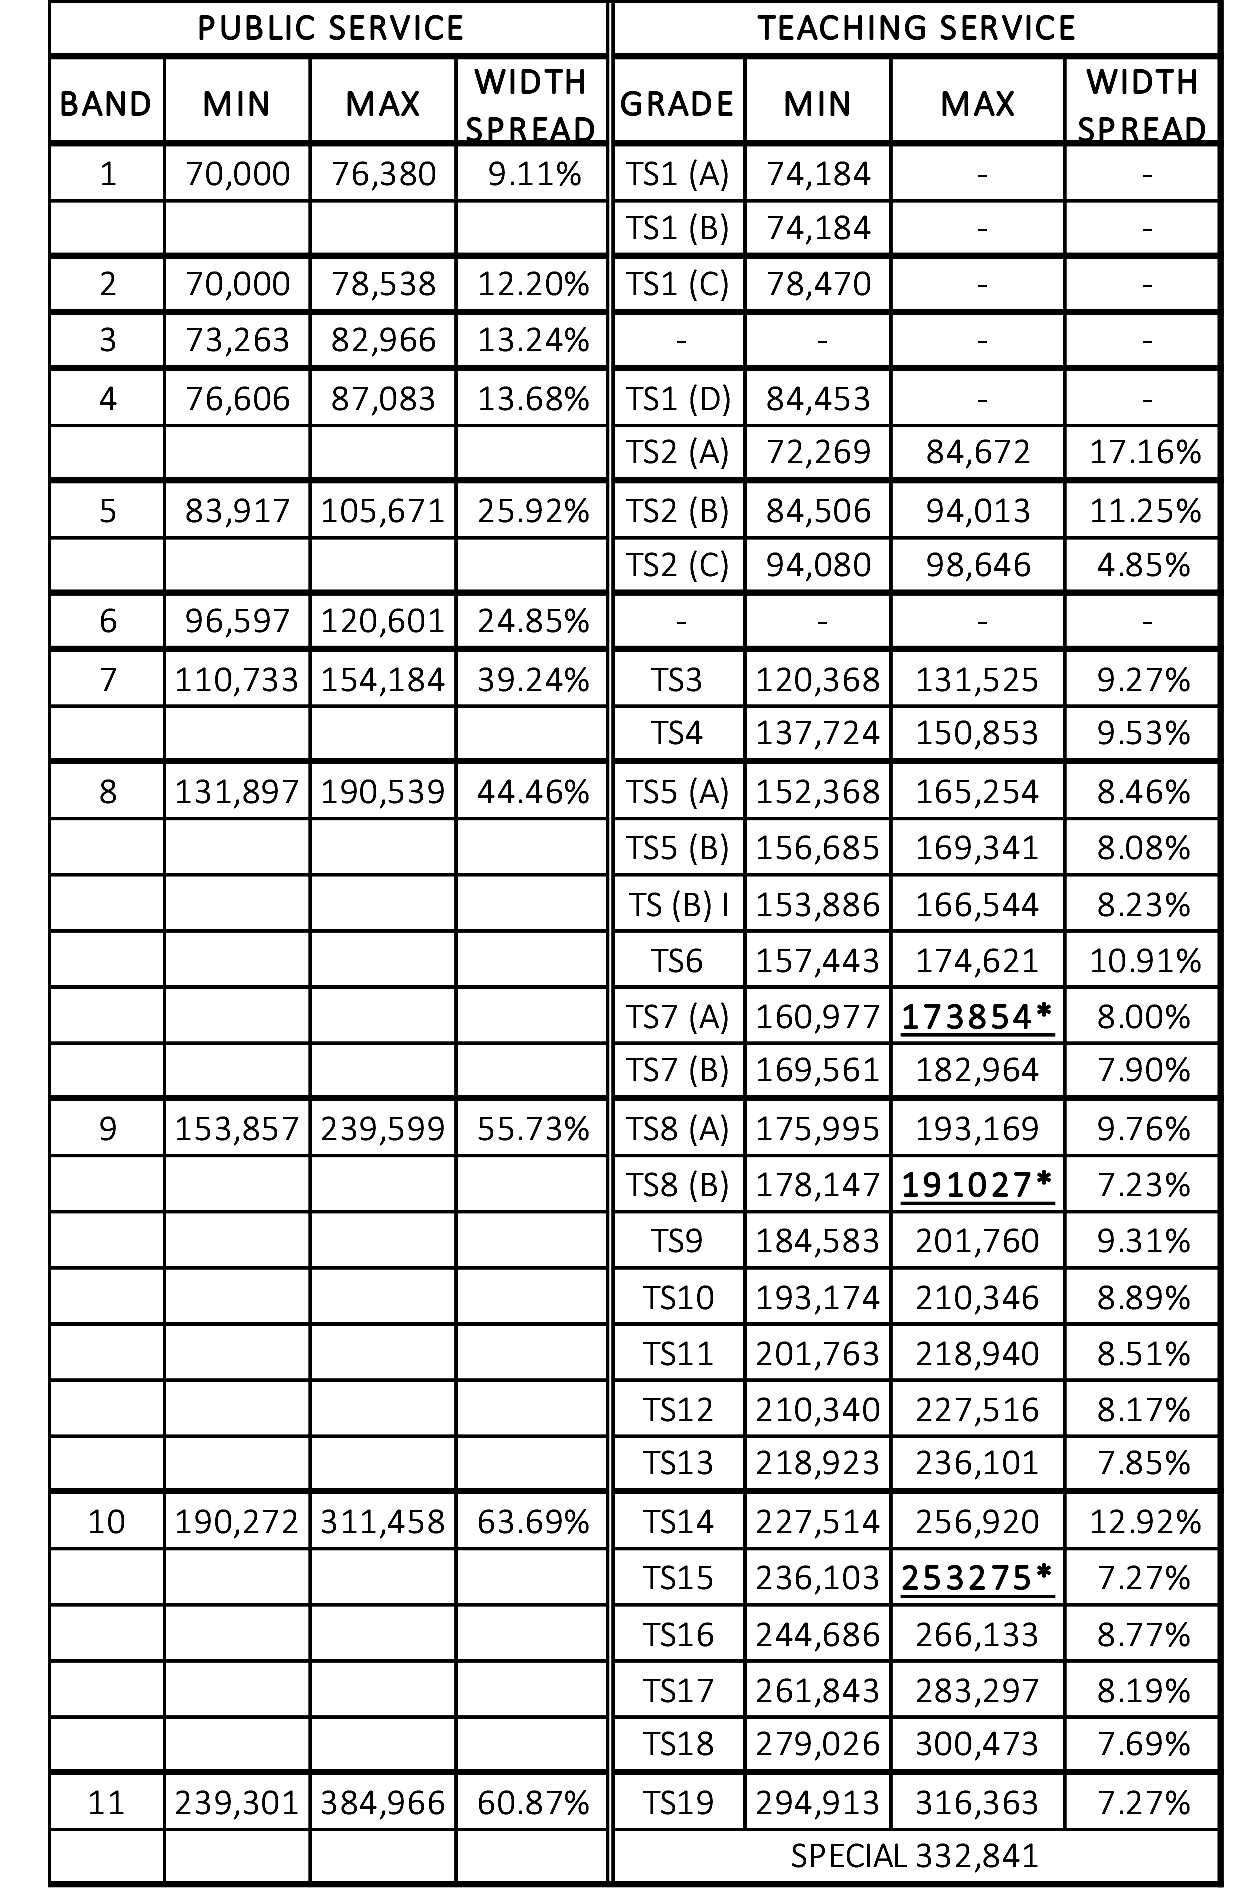
The Public Service compensation structure is constituted of 14 genuine scales, actually ascribed in the Budget approved by Parliament as Bands. It is to be noted however, that the same official document shows the Teaching Service compensation structure as constituted of Scales, except that the applicable Table begins with four grades – TS1 (A) to TS1 (D) – all of which show Fixed Salaries only. The comparable four bands in the Public Service reveal widths ranging from 9.11% at the bottom (Grade 1) to 13.68% at Grade 4. Quite unintelligibly, the next set of scales in the Teachers’ Service – TS2 (A) to TS2 (C) contain the greatest width (17.16%) – and the narrowest (4.85%) in that order. Just pause and reflect on salary scales anywhere in Guyana with a width of 4.85%. Teachers’ scales TS3 and TS4 have an average width of 9.4%. The salaries fall within the comparable Public Service Grade 7 scale of a width of 39.24%.
But the situation gets worse as teachers climb higher up the job ladder, for between their Grades TS5 (A) and TS7 (B) the average width of the six scales is 8.6%. This group relates to the single comparable Public Service band which is 44.46% wide. And it is not as if there is any consistency in these particular TS widths. The latter actually range from 8.46% at TS5 (A) to 7.90% at TS7 (B), with 10.91% being the largest width. But the higher one goes the more discouraging becomes the comparabilities, if they can be so called. Next the Public Service Band 9 of a width of 55.73% covers seven TS scales – TS8 (A) to TS13 of which the average width is a consistently disappointing 8.53%. But it is not as if the incredulity about this persistent mis-match stops there. For the Public Service Band 10, of an increasing width of 63.69%, further overwhelms the so called comparable five grades TS14 – TS18, which must again bow to an average width of 8.97%.
And if one considers all the above a bad joke, it is hardly funny that as at the bottom, the top teachers’ scale (?) is a fixed salary that falls well below the maximum of the Public Service Band 11 of a width of 60.87%. It is clear to any logical mind that it is not possible to accommodate any motivating performance appraisal system, moreso within a scale of a width (rather narrowness) of 4.85%. It becomes totally irrational when one counts twenty-four (24) scales, each one of a different width (?) ranging from 4.85% to 17.16%. No amount of artificial intelligence can resolve such a totally mythical arrangement. The Table below speaks for itself.
Sincerely,
E.B. John