Introduction
 Today’s column comes at the point where I am left only to discuss the export performance of the extractive forest sub-sector over the last decade (2006-2015). This will conclude my discussion of the microeconomic performance of the sector. This discussion is designed to determine whether this performance conforms to that indicated in the sector’s macroeconomic/national accounts assessment over the same period. Further, readers should recall that, thus far I have examined both ‘employment’ and ‘production’ of forest products as part of the microeconomic assessment. The information on these two conforms to the significant underperformance of the sector, as revealed in the macroeconomic/national accounts assessment.
Geographic market shares
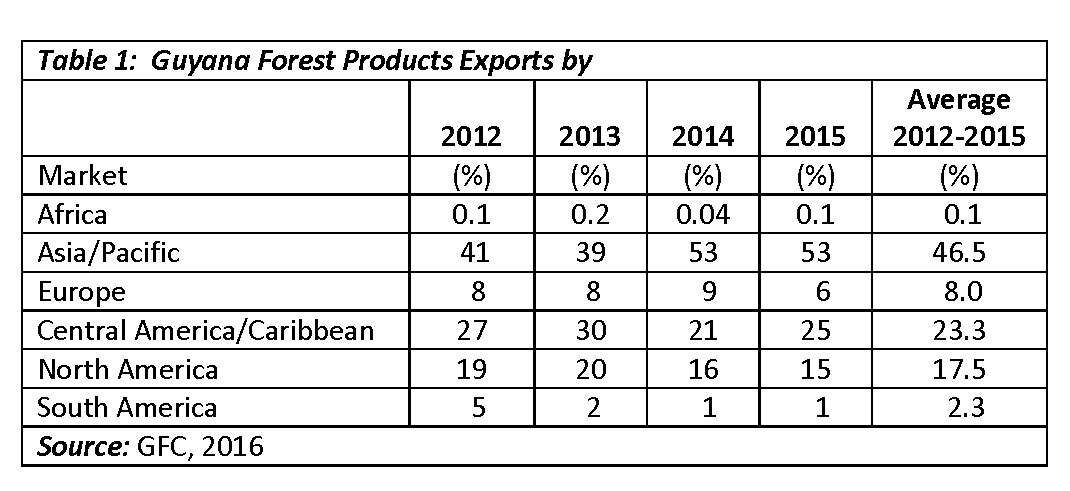
Table 1 indicates that, in recent years (2012-2015), Guyana’s export of forest products has had a wide geographic coverage. The leading market is Asia/Pacific, which receives on average 46.5 per cent of those exports. These exports have fluctuated substantially over the period, ranging from a low of 39 per cent of the total market in 2013, to a high of 53 per cent in both 2014 and 2015. Next in line has been Central America/Caribbean, which received an average of 23.3 percent of the total. This Region has also witnessed significant fluctuations, ranging from a low of 21 per cent in 2014 to a high of 30 per cent in 2013.
North America is third in importance. That region received about 17.5 per cent of the country’s exports of forest products. However, the variations for this region have been somewhat subdued, ranging from a low of 15 per cent in 2015 to a high of 20 per cent in 2013.
The three remaining regions in descending order of importance are: Europe, South America and Africa. Together, these purchase less than 10 per cent of the sector’s output; with Europe accepting 8 per cent, followed by South America 2.3 per cent, and Africa with a tiny amount (one-tenth of one per cent).
Total exports
Table 2 presents the reported data on Guyana’s total exports of forest products by volume and value over the decade, 2006-2015. The data reveal a reducing volume of forest products (timber) exported. Exports were at their highest volume in 2006 (277,899 cubic metres) and at their lowest in 2013 (112,970 cubic metres). Indeed the second lowest export volume was 119,645 cubic metres in 2012, and the second highest was 241,516 cubic metres in 2007.
This performance underscores the declining trend of output, which is even more evident when the data for the decade are presented in two five-year intervals. The first interval, 2006-2010, achieved on average an annual export volume of about 197 (000 cubic metres), as against the second interval’s export volume of approximately 156 (000 cubic metres). Annual average export volume for the decade was 177 (000 cubic metres).
The total value of these exports showed a broadly similar pattern. This indicates that annual unit price movements in export markets did not cancel out the impact of declining volumes. The annual average value for forest product exports obtained for the first interval 2006-2010 was approximately US$51 million and for the second interval (2011-2015) it was US$43 million. Annual average earnings over the entire decade was about US$47 million.
It should be observed that, disappointing as the export performance has been over the recent decade, there was a substantial increase on the level of export performance compared to two decades ago. Thus the annual average for 1996-1997 was 72,000 cubic metres exported, at a value of US$14 million.
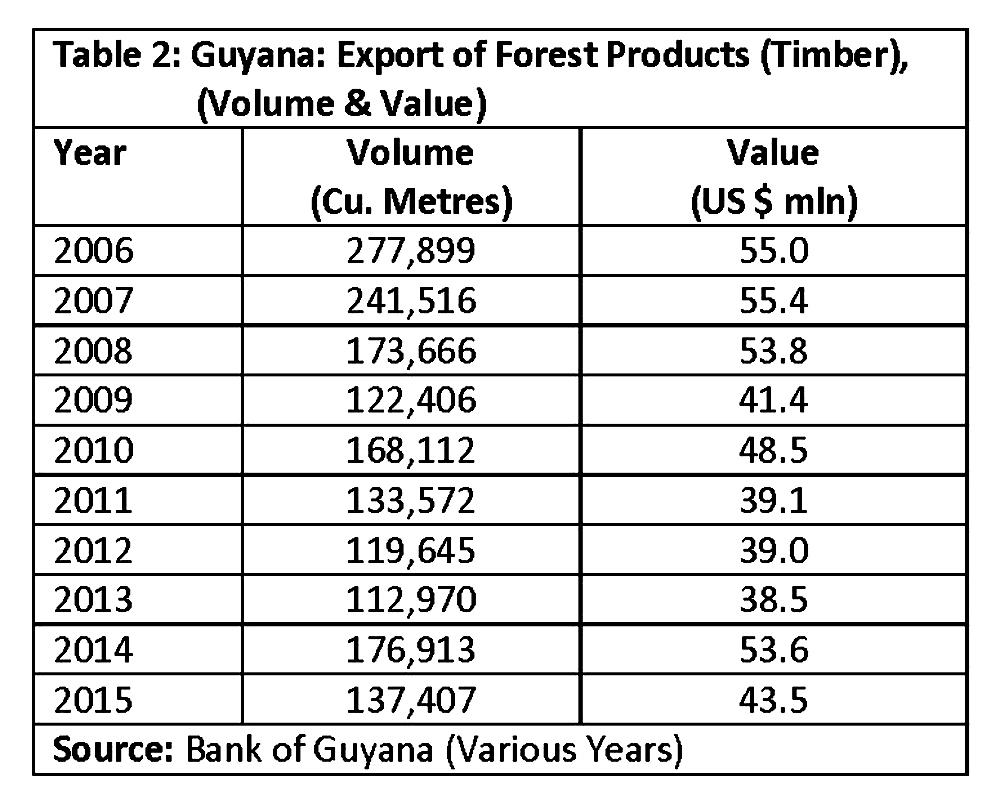
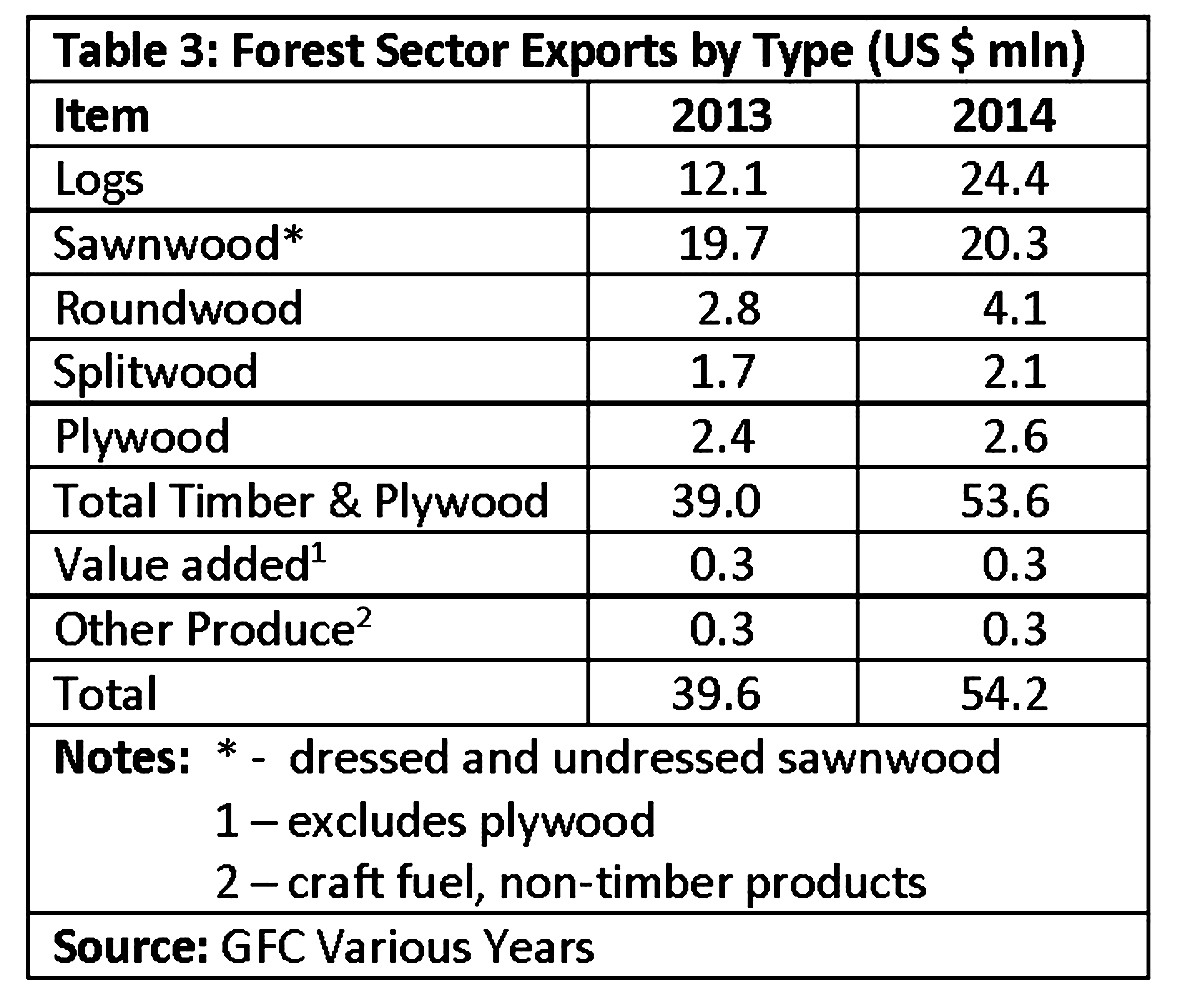
Table 3 completes the picture by showing the most recent forest sector exports for both timber and non-timber products by type of product and the export value earned in US$ million. It is clear that the bulk of exports continue to be logs and sawnwood (both dressed and undressed). In both years, 2013 and 2014, these two export products accounted for approximately 80 per cent of the combined total value of all exports. The data also clearly reveal that, value added and other non-timber produce continue to play only a marginal role in the export earnings of the sector.
Conclusion
Both Tables 2 and 3 support the picture revealed earlier and obtained from the macroeconomic/ national accounts appraisal of the sub-sector. In the face of Guyana’s vaunted standing in the world of forests, the economic returns obtained by the country to support job creation, sustain livelihoods, and combat poverty have been weak and declining, while exhibiting marked annual variations.
Significantly, this picture I have drawn of the export sector also conforms to the one that previously emerged from my presentation of the mineral sub-sector (gold and bauxite).
Next week I shall conclude the discussion of the forests, with some brief reflections on the recently published Guyana National Log Export Policy, 2016-2020.