Dear Editor,
The writer is indebted to Mr Milne Seymour whose letter to SN of May 16 (‘Comparing the GTU agreement of 2006 with that of 2011’) provided the information used again below, hopefully, in a more comparative format, inclusive of ready remarks.
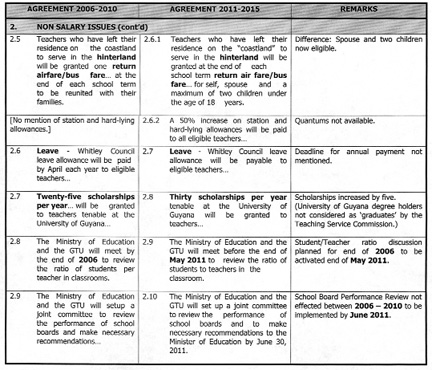
Comparing the GTU agreement of 2006 with that of 2011


Additionally the observations following are far from intending to be contentious, but merely relate some basic information about the current blight imposed on the teaching services, if only so far as compensation is concerned.
To begin with, it is instructive that there will be a discussion (five years overdue) on the ratio of students to teacher.
It should be a most interesting exercise, given the fact that no mention appears to have been made of a school grading system which (simplistically) takes account only of the student population. For example, to be a Grade A Secondary School the student roll must be between 550-699; for a Grade A Primary School the range is 750-999; while an equally graded Nursery School must carry a minimum of 250 students.
There are proportionate numbers for the secondary, primary and nursery schools graded B, C and D respectively. (Primary schools alone include a Grade E institution). Post-secondary schools are not graded, ie CPCE, GTI, NATI, etc.
It seems reasonable to conclude that there is a close relationship between the student:teacher ratio and the current school grading system.
The school grading formula is reflected in the salary hierarchy, and as a consequence the effective number of grades in the teaching service is 28, five of which are not on scales.
Regarding the reward for certified qualification, it is interesting that an amount is offered for a PhD, a qualification not required for any position in the teaching service, that is according to the commission’s stated educational requirements. On the contrary, the TSC regularly stipulates minimum experience in one grade as a criterion for upward movement, while there is simultaneous emphasis on performance (including that of school boards).
A perpetually disconcerting piece of logic to which the relevant stakeholders subscribe, is the punitive gap between the respective salary scales of a ‘Graduate’ Head Teacher and the ‘non-Graduate’ counterpart. In any grade of school the differential in remuneration is, more often than not, 7 scales – for doing exactly the same job and discharging similar responsibilities. Such a differentiation confuses the concept of rewarding performance.
The most curious conundrum of all is, however, that contrary to standard educational practice – ‘graduate’ in this teaching service refers only to the teacher trained in the Cyril Potter College of Education’s two-year programme. His/her counterpart emerging from the University of Guyana’s degree programme is not a ‘graduate’ for the purpose of remuneration in the teaching service.
The final rub is that comparison will show that up to immediately before the recent award of 5% increase, the values of 28 teaching service scales were comfortably absorbed by just 11 public service scales.
One intriguing example is of the maximum for a School Inspector – Scale GS11 $233,475, as compared to the fixed salary of the Principal, CPCE fixed at $196,250 (2011).
Why should teachers be happy about the fact that the average width of their salary scales is just about 9%, with the highest being approximately 13%, when the lowest public service scale GS1 is more than 14% – for cleaners and other unskilled categories?
The above does not exhaust the current inequitabilities.
What a triumph of negotiations!
Yours faithfully,
E B John