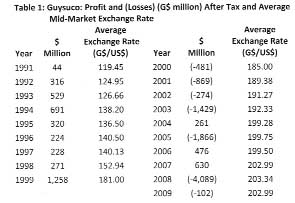
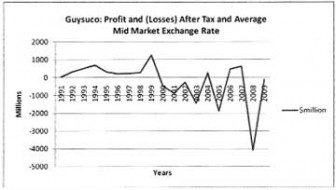
In last week’s column I had indicated that GuySuCo’s Report for 2009 stated that there was no payment of dividends for that year, as in many previous years. To my mind this statement reveals management’s resignation to the indefinite continuation of unprofitability. As the data in Table 1 and graph below show, while GuySuCo had earned a consistent profit after tax between 1991 and 1999, for the decade of the 2000s this situation was strongly reversed.
Indeed, in the 1991-1999 period profit after taxation rose from $44 million in 1991 to $1.3 billion in 1999. For seven years of the subsequent decade (2000s), GuySuCo has made losses. The total value of its reported losses was $9.1 billion, as against reported profits of only $1.4 billion for the decade.

Source: GuySuCo’s Financial Statements.
Labour productivity
Turning next to labour productivity as a performance indicator, readers should be aware that for me to be able to discuss labour productivity fully in these columns I would need as a minimum to have time series data for person days utilized by GuySuCo in its operations, categorized by type of operation: field, factory, administration, marketing and so on. Regrettably, the data I have managed to obtain for the preparation of this column are very spotty and cover only the decade 1991-2000. These provide 1) the number of tonnes of sugar produced per employee in that period and 2) the number of person days it took to produce a tonne of sugar for the same period.
In 1991 the output of sugar per employee was 8.28 tonnes. And, by 2000 this number had increased to 14.67 tonnes. This was a striking increase of 77 per cent. Not surprisingly, the data also reveal that in 1991 GuySuCo took 30.89 person days to produce one tonne of sugar and by 2000 it took only 14.50. This reveals a truly steep increase in labour productivity, as the person days required to produce a tonne of sugar was cut by more than one-half from 1991 to 2000!
Referring back to the information, which I provided in last week’s column for the five-year period 1995-2000 that showed a striking decline in the number of persons employed by GuySuCo for those years, the productivity data show that in 1995 the per employee production was 14.28 tonnes of sugar and by 1999 this had increased to 17.07 tonnes. Taken altogether, this information also indicates a high variability in the days actually worked by a GuySuCo employee in any given period of time. It is clear that there is no fixed number of days for a standard working week operating in the sugar industry.
Sugar cane yield
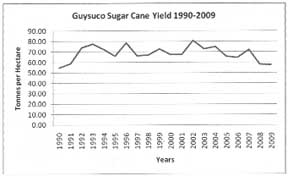
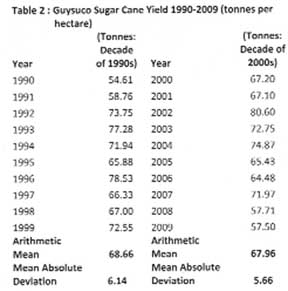
The next performance indicator I shall discuss is the yield of sugar cane obtained by GuySuCo over the two decades: 1990s and 2000s (1990-2009). These data are presented in the Table 2 and the graph below.
Source: GuySuCo’s Annual Reports.
The mean agricultural yield for the decade of the 1990s differed marginally from that of the 2000s (68.66 tonnes per hectare in the 1990s, as against 67.96 tonnes per hectare in the 2000s). However, there was significant variation in annual performances as revealed by the range and mean absolute deviations. For the 1990s, the range was from 54.61 tonnes cane per hectare in 1990 to 77.28 tonnes in 1993. For the 2000s, the range was from 57.50 tonnes per hectare in 2009 to 74.87 tonnes in 2004. The mean absolute deviations for the two decades, 1990s and 2000s, are 6.14 and 5.66 respectively.
It is instructive for readers to note that going as far back as 1960 when Guyana was not yet independent and the industry was under foreign ownership and control, the tonnes of sugar produced per hectare were as many as 94.39 tonnes. It is noteworthy too that the achievement in 1960 was about two-thirds higher than the average obtained during the two most recent years for which I have data (2008-2009).
Next week I shall conclude this examination of GuySuCo’s performance indicators.


