Introduction
Today’s column focuses on the finances and petroleum metrics embedded in the Buxton Proposal. It offers guidance and insights into the anticipated affordability of the Proposal from a national standpoint. The material difference from the original presentation is due to the publication of the IDB’s Technical Note, cited last week [IDB-TN-1994]. This was produced in August 2020, months after Guyana’s First Oil in December 2019. It is entitled, ‘Traversing a Slippery Slope Guyana’s Oil Opportunity.’
In essence, I am confident that the detailed finances and petroleum metrics that I had previously proffered are confirmed by the estimations in the IDB study. The estimates continue to center on three crucial relations, the first of which is that I have posited thst the future value of earnings from Guyana’s petroleum sales is primarily dependent on three functions: 1) its projected petroleum reserves; 2) its expected daily rate of production, DROP expressed in barrels of oil equivalent, boe; and 3) the price at which each boe is sold/ valued.
Secondly, the projected overall profit can be readily deduced from petroleum sales. Basically, projected total profit earned on the total boe sold is mainly a function of the overall volume of sales; the price at which each boe is sold; and the cost of production incurred in the production of each boe.
Thirdly, what share of the profit obtained from each boe is expected to flow to the Government of Guyana, GoG? As used in this series, this share of the profit is termed the Government Take. This Take is determined by the terms of the various applicable Production Sharing Agreements, PSAs, governing companies that have been allocated Guyana oil blocks.
Approach
Going forward, I shall summarize these three relations in the order indicated above. Before that, I need first to draw attention to a few related matters for context. First, I shall utilize simple schedules to illustrate the relations and my projections. Second, unless otherwise stated, my projections are based on the “full ramp-up”, target level of oil and gas production, as listed below. Third, Rystad Energy has modelled Guyana’s petroleum metrics/revenues, as revealed before in my publication the Guyana Petroleum Road Map. The relevant information from that work is restated, at appropriate stages later on. Fourth, I have applied my values to compare with the Rystad Energy model. As to be expected, these values yield different outcomes.
Relation 1: Guyana DROP
There are various projections of Guyana’s oil and gas reserves. I have been “strongly bullish” on this indicator; in contrast to my “conservative estimation” of Government Take. Here, I recall the ridiculously low estimates (one to two billion barrels of oil) posted in the media following the Liza discovery in May, 2015. However, I have projected from the outset, in the Guyana Petroleum Road Map, Guyana’s potential petroleum reserves at 13-15 billion barrels of oil equivalent, boe.
As previously indicated, my rationale for this estimation is founded on two considerations. One is the “mirror image theory” of oil concentration in the physical areas where, over geological time, the continents of Africa and Southern America, previously joined together as one land mass, separated into two distinct continents. The other consideration is the result of two United States Geological Survey (USGS) assessments of undiscovered fully risked oil and gas resources in the Guyana-Suriname Basin. The USGS results are summarized in Table 1 below.
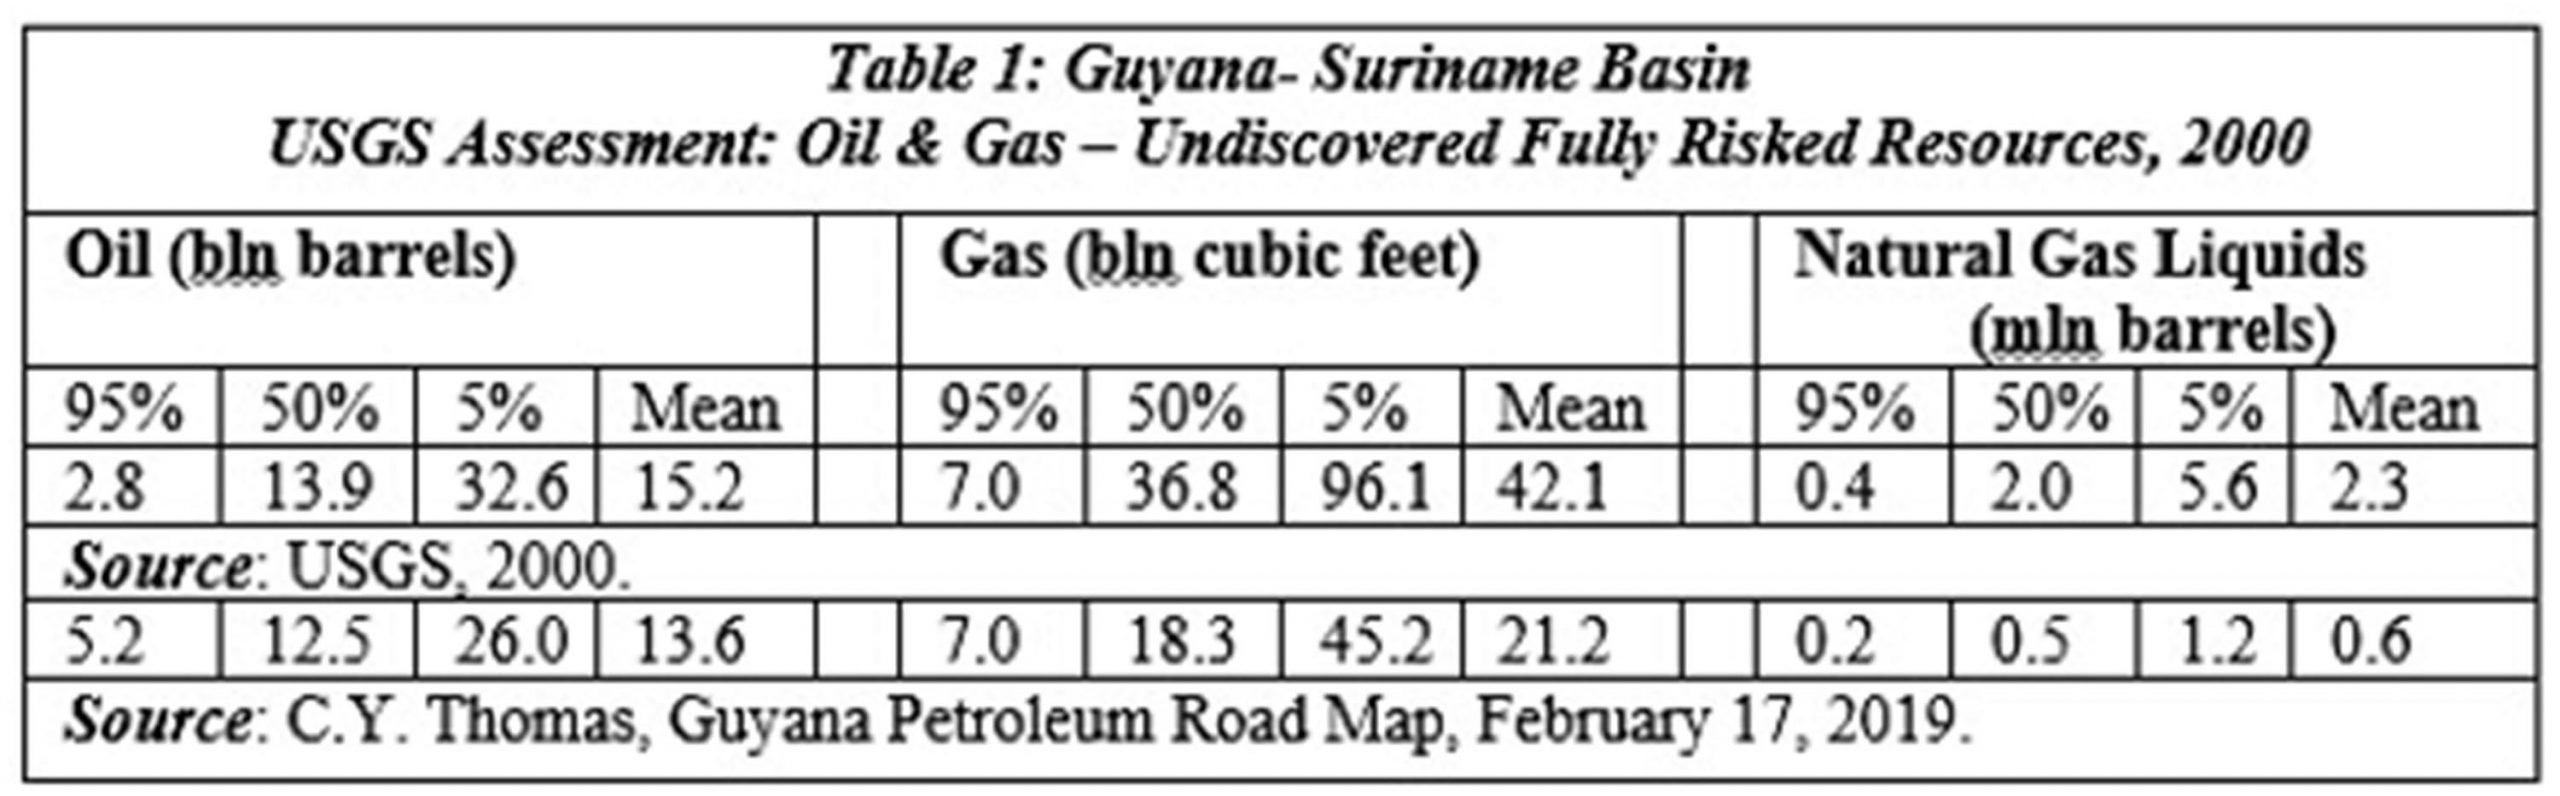 For the next step of the analysis, I then compared Guyana’s potential reserves against proven national petroleum reserves estimates, as reported and ranked globally (Wikipedia). This ranking indicates that countries with similar proven reserve volumes to Guyana’s potential, produce between 1.5 and 2.5 million boe per day. I have therefore concluded from this that, at full ramp-up, Guyana’s DROP will fall within this revealed range. As we shall observe, for purposes of calculating the petroleum metrics, I have utilized both the lower and higher range level. These provide a DROP between 1.5 and 2.5 million boe per day. This range informs my projections for Guyana’s petroleum output and, consequently, earnings potential for Guyana, at full ramp-up, based on the expected Guyana crude oil market price.
Price
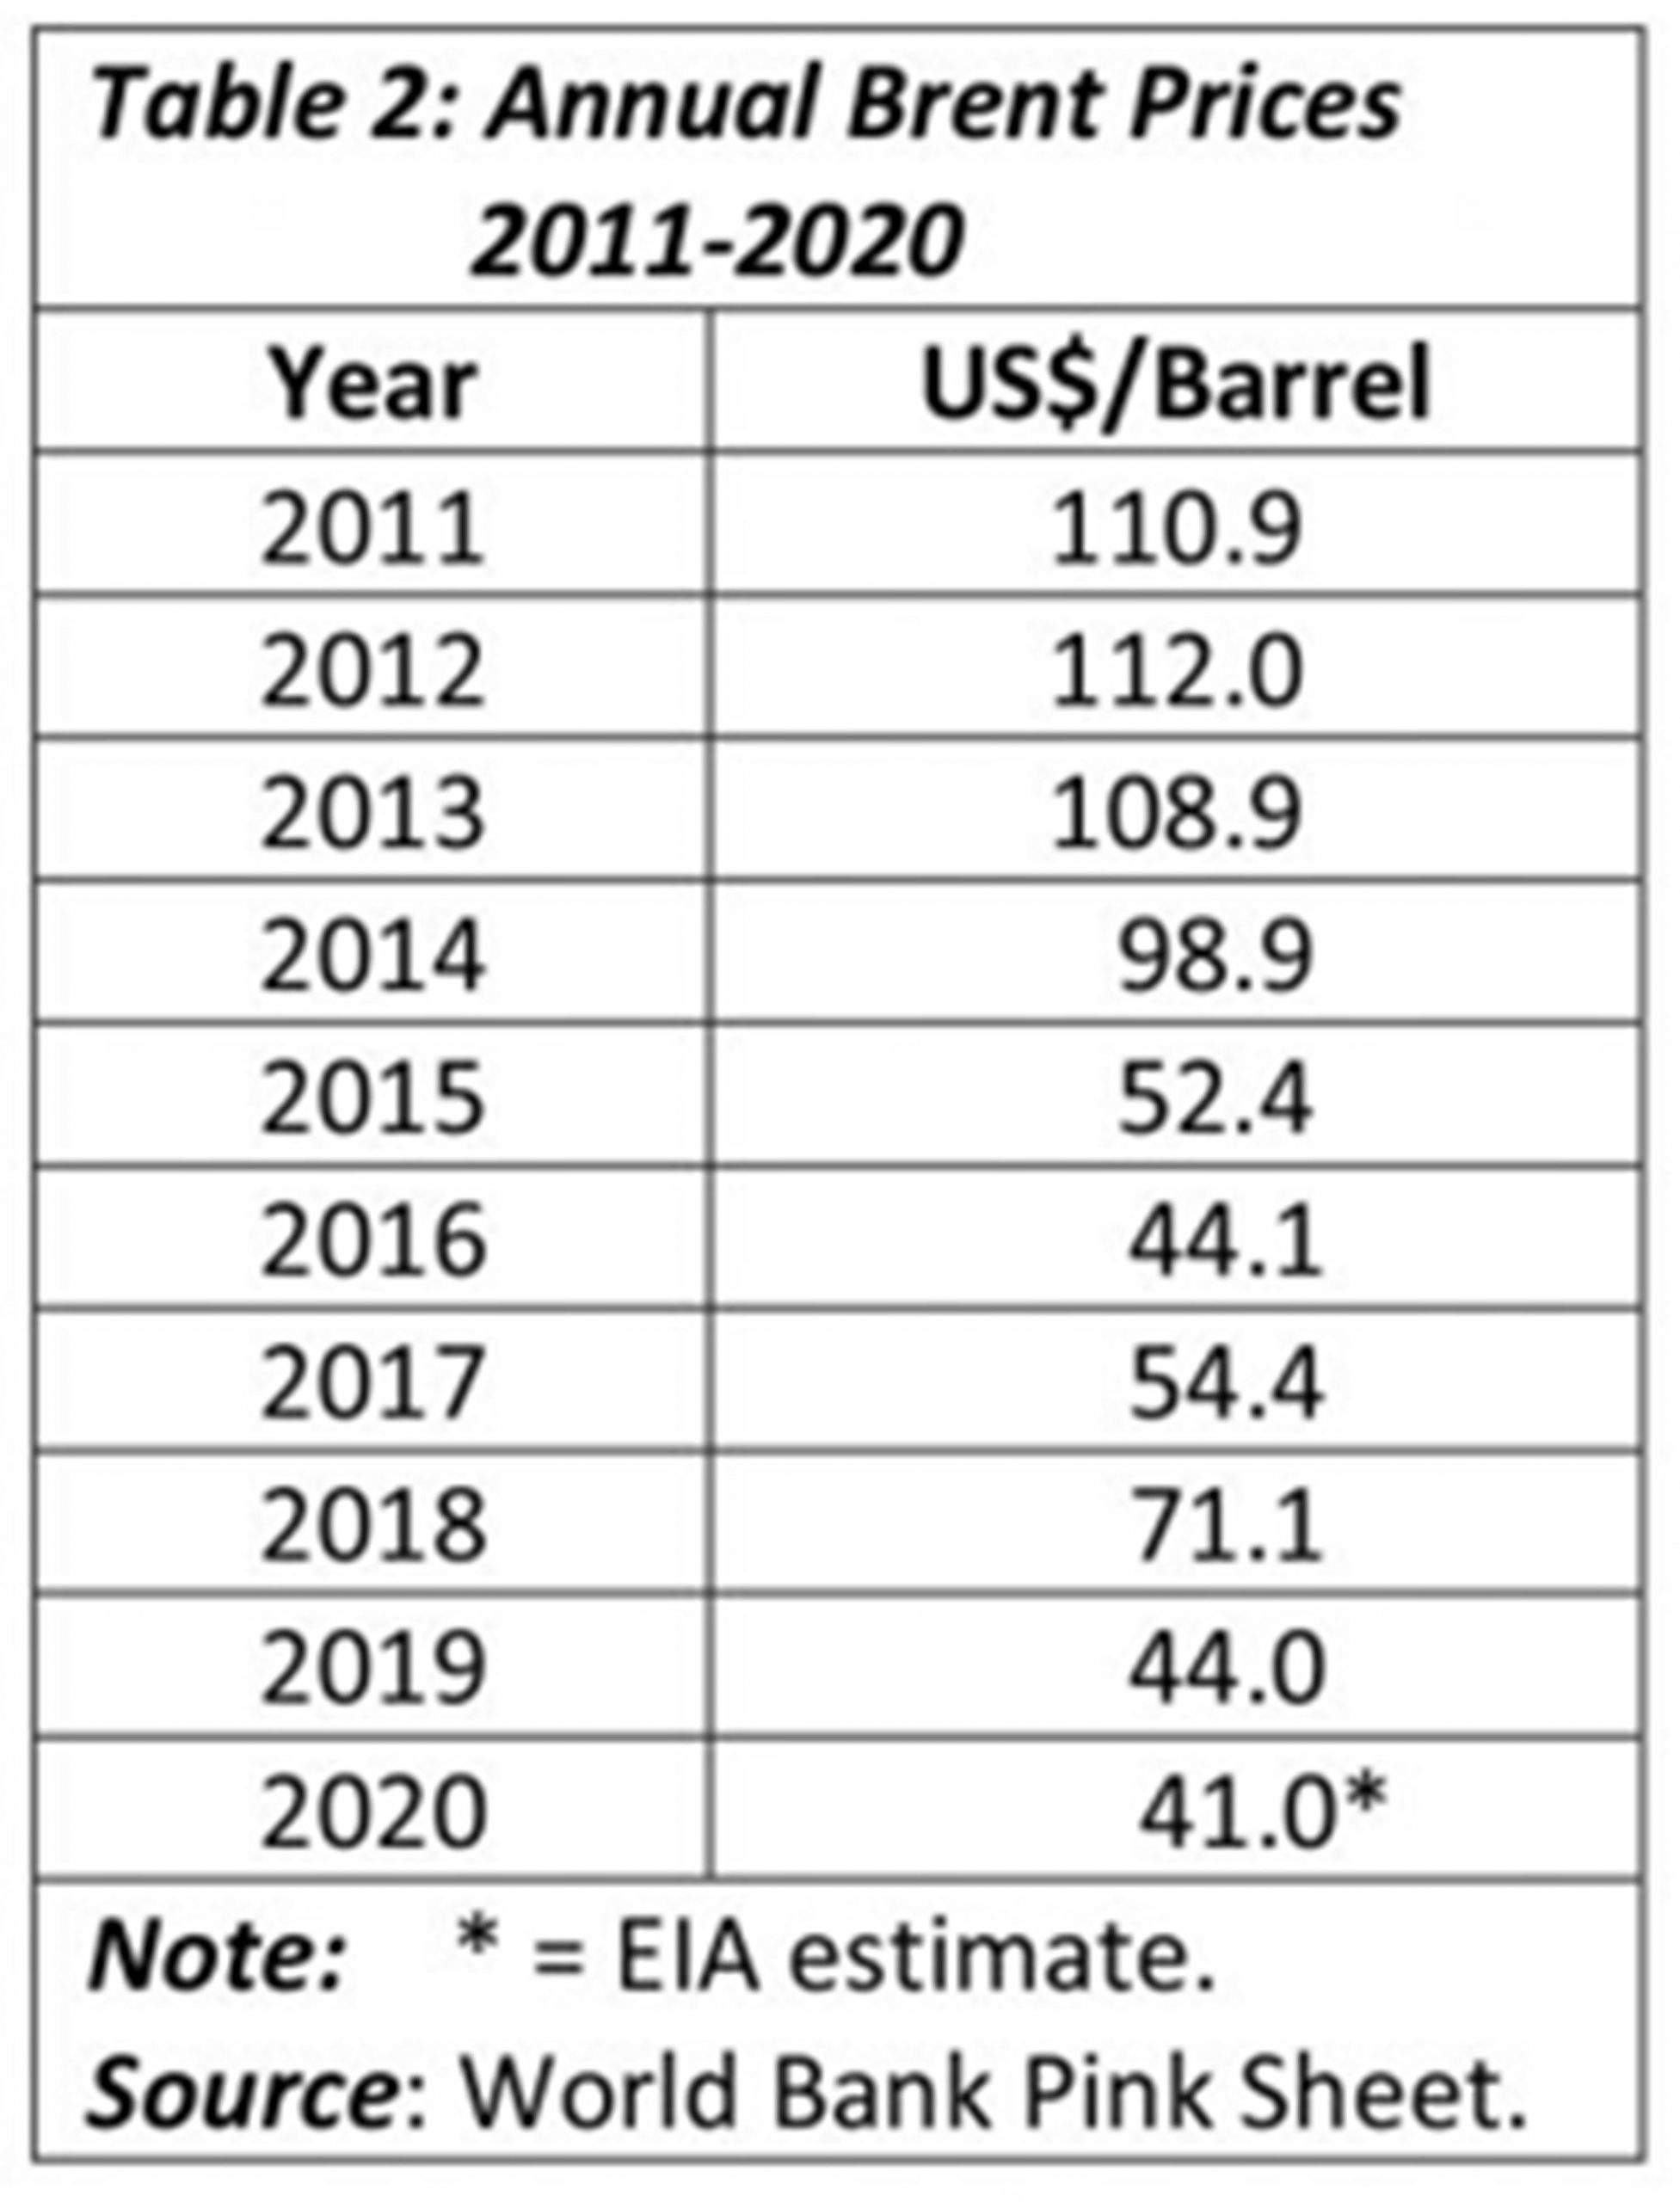
Based on this type of analysis. I have used a Brent price of US$70 per boe at the time of full ramp-up in Guyana’s DROP. As indicated in the original version of this Proposal, Rystad Energy had modelled Guyana’s crude oil performance at a Brent price of US$ 75 per boe at full ramp-up. All prices cited here are nominal, unless stated otherwise. A comparison of the price I utilize is obtained by referring to Table 2, which shows the price of Brent over the past decade. Based on a DROP that ranges from. 1.5 to 2.5 million boe, these yield annual gross earnings of roughly US$ 35.billion to 60 billion US dollars.
 Government Take
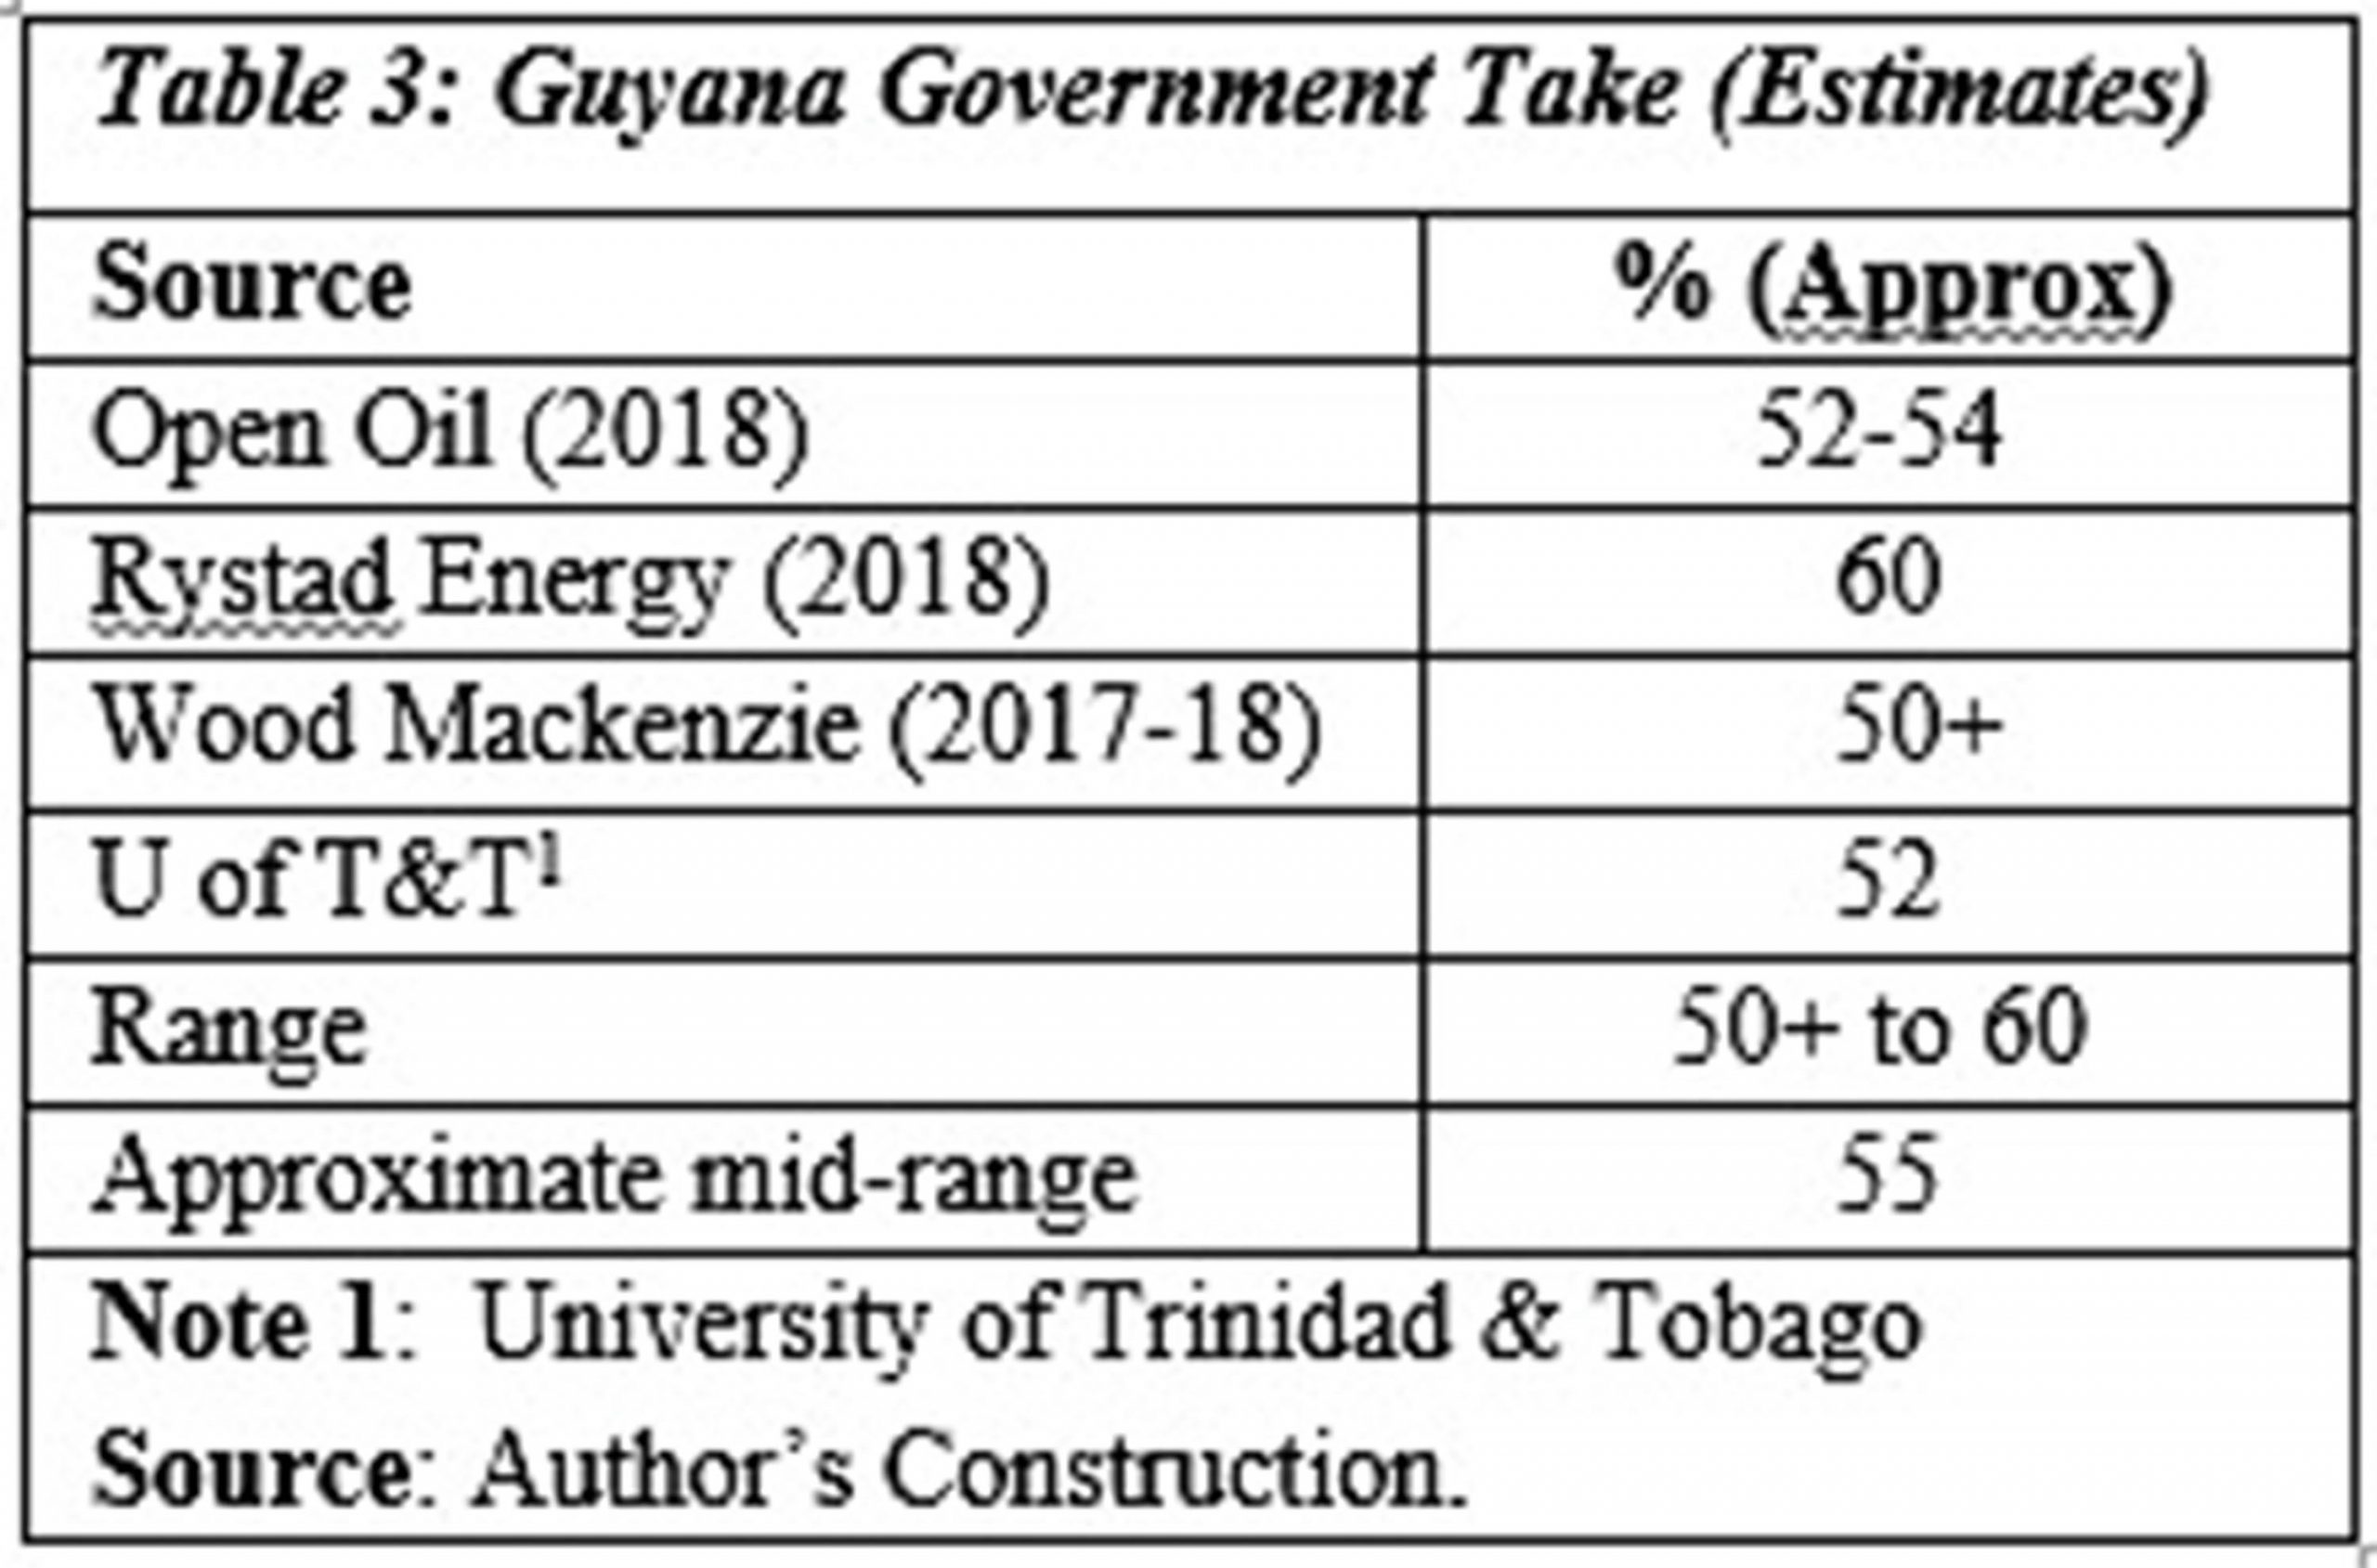
The first edition of the Buxton Proposal drew upon four published estimates of Guyana Government Take namely; Open Oil 2018, Rystad Energy 2018, Wood Mackenzie 2017-2018, and the University of Trinidad and Tobago. These ratios are shown in Table 3. These results indicate the range in the estimates is from 50+ to 60%. The mid-range was used to model my projection of the Government Take ratio.
 Conclusion
The above sums up how I arrive at the first relation, expressed in the petroleum metrics. That is, how I estimate projected petroleum earnings, and the share of Government Take (revenues) yielded out of petroleum sales. As earlier stipulated, all values stated here are nominal, when applied to the full ramp-up production target.