 This essay is an extension of the previous one on September 10: ‘Balances due from abroad and the foreign exchange “shortage”’, which argues that there has been a precipitous decline in the availability of the liquid stock of foreign exchange available to the non-bank private sector, although the aggregate level of foreign exchange is on the rise. The liquid stock represents the amount of commercial banks’ net foreign assets that is available to clear cheques of Guyanese doing business overseas. In other words, the country is earning an unprecedented level of foreign exchange, yet the amount available to lubricate the engine of commerce is decreasing.
Guyana witnessed its largest current account surplus in 2022, amounting to US$3.825 billion given the giant expansion of oil export. The last current account surplus of US$27.6 million occurred in 2016. All the other years since 2013 have been deficits. The current account balance accounts for the difference between exports and imports of goods and services, as well as incomes of foreigners who invest in Guyana (less incomes Guyanese earn overseas), and inflows of remittances and other transfers.
The current account balance does not tell exactly how much hard currencies are flowing through the Guyanese foreign exchange (FX) market. Take, for example, a large payment of ExxonMobil to a foreign vendor in Singapore. The payment does not filter through the Guyanese foreign exchange market, although it is recorded in the balance of payments.
In order to figure out the amount of foreign currencies (US dollars, euros, Canadian dollars and pound sterling) that are passing through the local market, we can examine the levels that are purchased and sold by bank and non-bank cambios. Readers will recall that I have written numerous columns since 2009 utilizing this dataset. In previous columns using this data, we observed that commercial banks trade (buy and sell) 99% of all foreign currencies in the local market.
As we examine the purchases and sales of hard currencies, we must recall that banks are not only in the business of buying and selling foreign currencies in order to make a profit, but also make loans – which are usually extended to long-established customers. Banks face many information problems when making loans, meaning that they do not know for certain whether the loan will be repaid. Therefore, one way to circumvent the asymmetry of information (the borrowers always know more about their true intention) is to lend to customers with whom they have had a long-term business relationship.
Furthermore, if banks have extended hundreds of millions of dollars to large borrowers, they are going to prioritize selling hard currencies to these customers who have international business transactions. The last thing the banks want is to imperil their existing loan portfolio by jeopardizing the ability of their customers to repay. This is one of the ways a completely privatized banking system works – one without not a single government development bank.
The first chart shows the pattern of sales and purchases from 2013 to 2022. Before we discuss the chart, let us try to understand what these two series indicate. The banks’ purchases measure the source of hard currencies to the market (supply of the non-banks to the market). These are exports, capital inflows, remittances and other sources. The banks’ sales indicate uses of foreign exchange such as imports, capital outflows and other uses (the non-bank sector’s demand for hard currencies).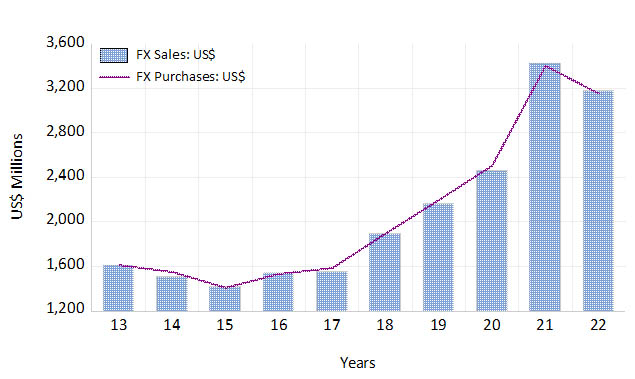
It is clear that more foreign exchange is being traded in the market over time. There is a favourable steepening of the trend from 2017 as investors anticipate the oil rush. However, there is a decline from 2021 to 2022. Nevertheless, the 2022 sales and purchases far exceed their corresponding amounts in 2013. For example, sales in 2013 amounted to US$1.59 billion while sales in 2022 was US$3.17 billion; meanwhile, purchases in 2013 was US$1.61 billion compared with US$3.15 billion in 2022. It is clear, then, that in the aggregate there are more hard currencies being traded in the market.
What is more important, however, is the difference between sales (uses) and purchases (sources) of foreign exchange. If sales exceed purchases we have a situation of tight FX market – more uses and sources. In such a situation there is a binding foreign exchange constraint, which is a definition I have worked with going back to 2006 until recently when I published a paper on Papua New Guinea exploring the implication of this same constraint for that country’s monetary policy. The opposite is true: if sales are less than purchases we have a surplus of foreign exchange in the Guyanese market. The next chart shows the sales minus purchases outlook from 2013 to 2022.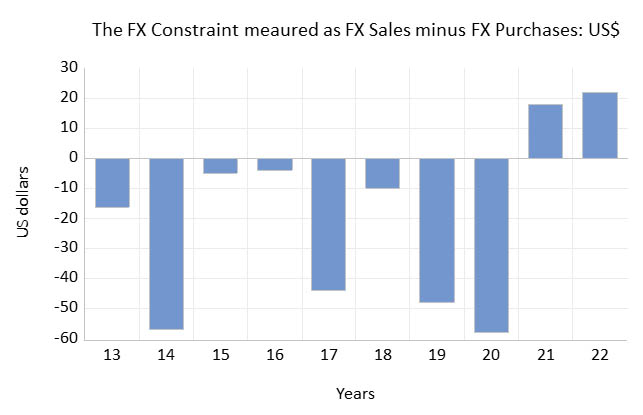
The negative values from 2013 to 2020 show that there were always more sources (supply) than uses (demand) of foreign exchange. In other words, the foreign exchange constraint was non-binding. This situation reversed in 2021 and 2022, two years of feverish oil and gas explorations and oil exports. The two largest surpluses occurred in 2014 and 2020, respectively, amounting to US$57 and US$58 million. In contrast, in 2022 the market was in a shortage amounting to US$22 million.
We can draw a similar conclusion from these two charts as we drew from the two charts presented in the previous column. In the aggregate, there is more foreign exchange in the system. However, the non-bank public’s demand for foreign currency (sales) is much larger than the non-bank public’s supply.
What explains this situation? Before we can explain this paradox of plenty, I want to note that the small amounts of foreign exchange changing hands among the banks do not represent a causal factor. The latter transactions refer to the interbank FX market, which should not be confused for the much larger purchases from and sales to the non-bank public. The interbank trading is quite small relative to the large purchases and sales given earlier in the first chart. For example, in 2020 the banks only traded US$2 million among themselves, while in 2021 and 2022, respectively, they bought and sold among themselves US$21 million and US$32.3 million.
If the thin interbank trades do not constitute a causal factor, then what explains this anomaly? First, it should be noted that import as a percent of GDP was 23.4% in 2022, significantly less in percentage terms than the import penetration of previous years. For example, import as a percentage of GDP was 71% in 2018. It is obvious that Guyana’s GDP has grown astronomically faster relative to imports resulting in a nominal GDP of US$15.36 billion. Second, the largest budget ever in 2022 amounting to G$553 million is still only 17% of GDP in 2022.
However, it is the rate of growth that matters, not the ratios of import and government spending relative to GDP. The growth rate has to be consistent with the absorptive capacity of the economy. The fantastic growth in GDP on account of the rapid rise of oil export is “sterilized” overseas in terms of the share going to the Natural Resource Fund and the reminder to ExxonMobil and partners. However, high growth in internal factors such as bank credit, non-bank credit, money supply and the fiscal deficit all will create demand pressures that will show up in the foreign exchange rate and quantity traded. We will have to pick up this point in a future column because I do not wish to submit more percentages and data.
A second explanatory factor that has to be considered is the inconsistency of stabilization policy relative to the expansion of bank (and non-bank) credit and the fiscal deficit. The three-month Treasury bill rate has not changed in years, remaining at 1.54% in spite of the fact that the US federal funds rate is now at 5.33% as I write this column. The low Guyanese policy rate coupled with the policy of a G$3 spread between the cambios’ buying and selling rates are counterintuitive. The inconsistency of stabilization policy means that banks are not motivated to have liquid foreign exchange to lubricate the wheels of Guyanese commerce. Rather, they lock away foreign exchange in time deposits in foreign counterpart banks.
We will pick up these explanations in the next column. Suffice to say, the rapid growth in internal demand and government spending are pressing against the economy’s absorptive capacity.
Comments: tkhemraj@ncf.edu