Introduction
As pointed out in the conclusion of last week’s column, today’s will wrap-up my current efforts to interrogate the IDB report on Guyana’s Oil Opportunity and its estimation of likely Government of Guyana (GoG) revenues. I focus on three areas of concern. These are, respectively: 1) the IDB’s and comparative estimates of government take; 2) some of the economic features revealed from the modeling of the five projects; and 3) a brief comment on a few of the policy implications drawn by the IDB based on its modeling results.
In what follows, the three topics are addressed in the order listed.
Comparative Government Take
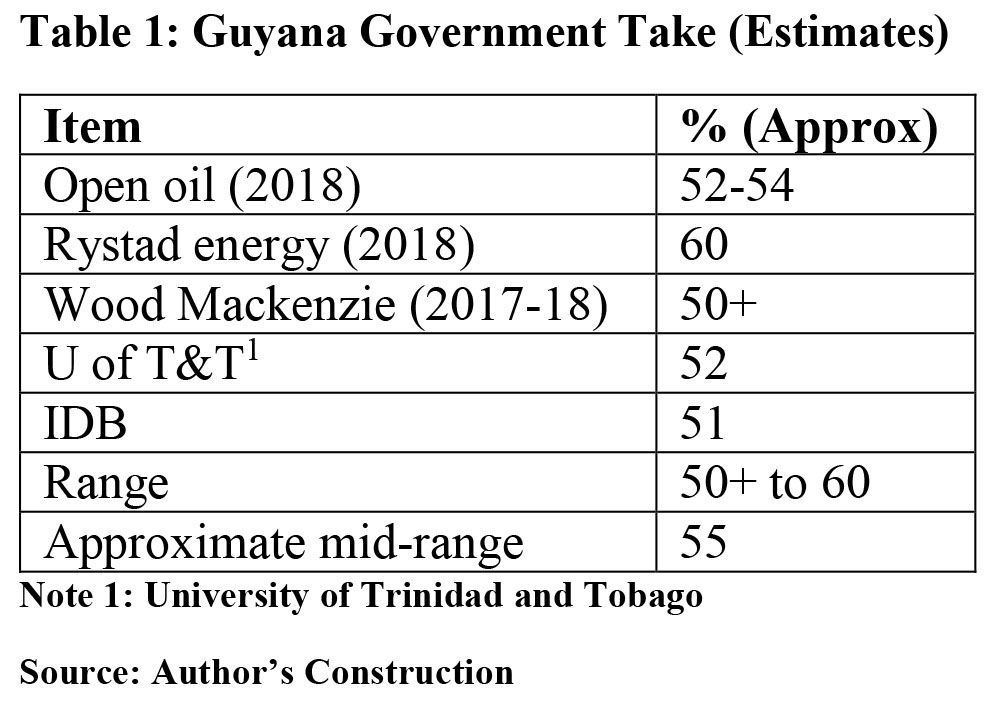
I have never seen official estimates of the expected net cashflow share ratio made by either of the Parties to the current Stabroek Block PSA – contractor or GoG. I have seen results for six independent measures of Government Take. Three of these have been conducted by non-commercial bodies; that is Open Oil, a global NGO; the Faculty of Engineering, University of Trinidad and Tobago; and, the Inter-American Development Bank (IDB). The other three were conducted by two petroleum intelligence business consultancy firms. These are Rystad Energy (one) and Wood Mackenzie (two). These data are shown in Schedule 1 below.
While I have not had access to their worksheets, I have benefited from extensive access to notes and reports on the models employed in the modeling exercises undertaken by the three non-commercial bodies reported on in Schedule 1, Access to the commercial bodies’ information is fee-based and I cannot afford to purchase these reports. This is the reason why in earlier columns I was able to report at some length on the estimation of Government Take by the University, Open Oil and on-going the IDB. Indeed, I have reviewed the Open Oil modeling exercise over eight consecutive columns during 2018.
Table 1 portrays the range in the estimates of government take is from 50+% (Wood Mackenzie) to 60% (Rystad Energy). The mid-range is, therefore, approximately 55%. The 60% value is an outlier as four of the five results cluster in the narrower range of 50+ to 54%, The IDB result of 51% seems consistent with the pattern of results yielded in such exercises thus far. As noted above, the Rystad Energy’s result is the outlier value.
The Model Economics
Table 2 below has abstracted some useful economic data derived from the IDB’s modeling of the five projects: Liza 1, Liza 2, Payara, and the not-yet- named Projects 4 and 5. The Table shows data on: 1) the cash flow for the five projects, before the closure or de-commissioning fund; 2) net oil revenues flowing from the five projects; and 3) their overall, as well as individual items per barrel cost of production.
Table 2: IDB FARI-Model Reported Cost per barrel
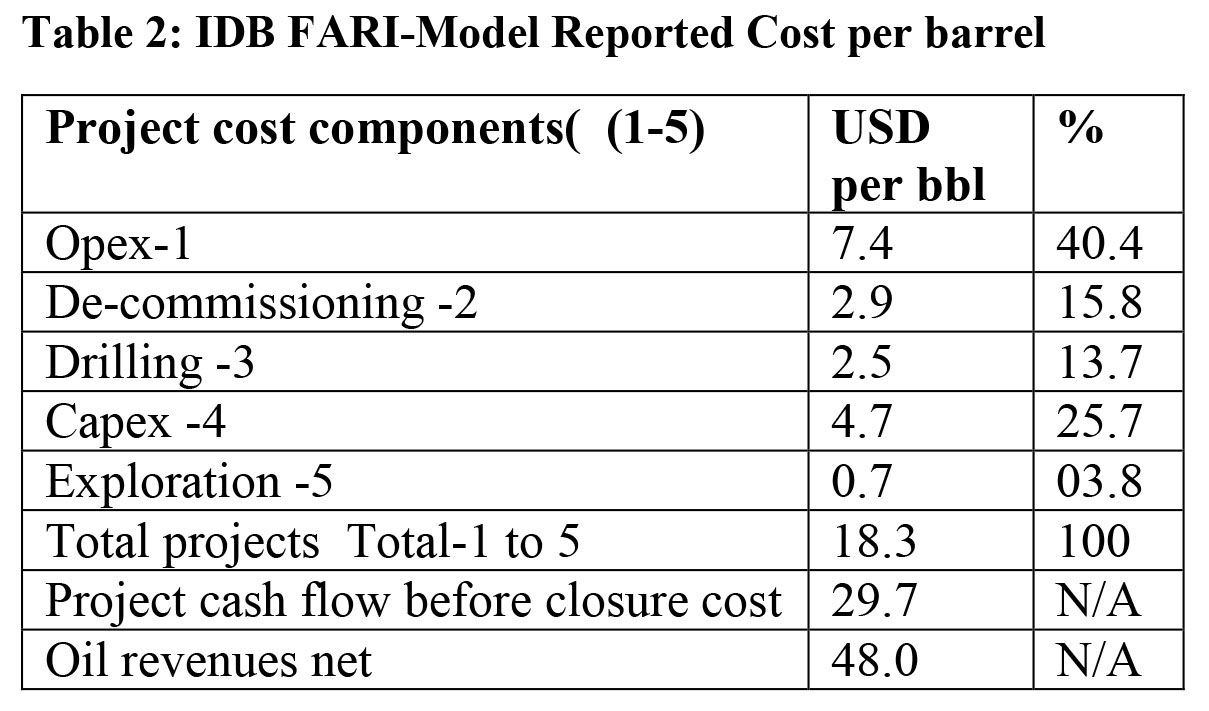
The data reveal that, the item operational expenses, opex, constitutes the largest single item responsible for the cost of producing a barrel of crude oil on the Stabroek block, with ExxonMobil the lead contractor. Opex refers to ExxonMobil’s day-to-day operational expenses like wages and salaries, rent, utilities, legal and accounting, general and administration, overheads, R&D, and so on. These expenses keep the company operating and account for US$7.4 per barrel of crude oil produced. This represents 40.4% of the estimated US$18.3 required to produce one barrel of crude oil in the model.
Capex or capital expenditures at US$4.7 per barrel is the second largest item, accounting for 25.7% of the per barrel cost. While opex focuses on the ongoing short-term expenses of the contractor, capex focuses on longer term significant expenditures designed to improve future ExxonMobil performance beyond the current fiscal year. Typically, such long-term expenses include property, plant, equipment, and other fixed assets. The emphasis is on longevity; that is designed for use beyond the current fiscal year. Together, the model reveals that opex and capex combined account for about two-thirds of the cost of producing a barrel of crude oil.
To have nearly one- sixth of the cost for producing a barrel of crude oil devoted to a de-commissioning fund belies the noise and nonsense narrative in print and social media concerning Guyana’s uncatered for abandonment of its oil and gas structures when the reservoirs are depleted. Similarly, the narrative of the endless burden of gargantuan exploration debt comes up against the reality that, exploration debt is projected to account for only 70 cents or 3.8% of the per barrel cost of producing a barrel of crude oil on the Stabroek block
Concluding Observations
Based on its main findings, the IDB has observed that, independent of the quality of the current PSA: it is self-evident, improved governance of the nascent hydrocarbons sector (institutional organization and regulatory oversight) is a high priority for lifting Guyana’s ability to contain value leakages along with improving its share of value capture. This is indeed a recurring theme undergirding my columns from their inception.
While my main concern about the IDB report for this series of columns has been its modeling of government revenues I repeat my earlier strong recommendation for readers to do their reading of this document. Indeed, its last two sections, 5&6, make recommendations on: 1) value capture and why institutions matter; and 2) governance and institutional arrangements. The latter briefly draws lessons from other countries’ experiences; namely, Norway, Brazil, Colombia and Mexico.
Conclusion
The series continues next week.