
Introduction
Each of the past three columns (#’s 88 – 90) reviewed the financial statements of one of the three oil companies which signed the 2016 Petroleum Agreement with the Coalition Government of President Granger. Today’s column compiles the income statements from the separate financial statements, making some minimal reclassification for the sake of convenience, comparability and readability. But first, a brief explanation of the Table.
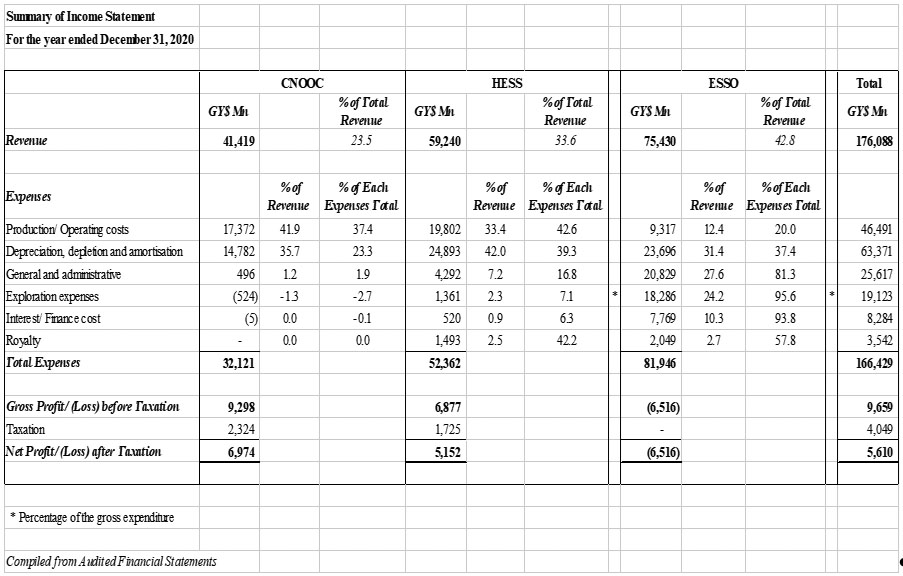
The Table is expressed in millions of Guyana Dollars (GYD Million). The top line of figures is the revenue of the three entities while the percentages represent their share of total revenue earned. The line items of expenditure show for each of the companies the reported expenditure on the stated categories such as Production Operating Costs; Depreciation, depletion and amortisation; General and administrative; etc. The percentages in the first column following the numbers show the percentage which the expenditure bears to the revenue of the respective entity while the percentage in the next column is the proportion which the class of expenditure bears to the sum of that class for the three entities. To take one example: Production/operating costs for CNOOC accounted for 41.9% of its revenue but 37.4% of the total Production/operating costs incurred by the three companies.
Commentary on Income statement
Esso holds a 45% interest in the Stabroek Block while Hess has 30% and CNOOC holds the remaining 25%. The reported revenue approximates to those interests with Esso’s share of revenue (rounded up) accounting for 43%, Hess 34% and CNOOC 24%. The disparity in sales to the companies’ interest in the operations can partly be accounted for by the unsold crude oil at December 31: Esso had some $1.731 billion dollars’ worth of unsold crude while Hess had approximately $334 million. CNOOC had none.
Given that the relationship among the three is essentially one of a joint venture, not only is income expected to reflect the respective interest but so too is expenditure. On a total level, reported expenditure by CNOOC was 19% of the total expenditure, Hess 31%, and Esso, 49%. It is either that CNOOC, the most profitable of the three companies, is underspending or Esso is overspending. But that too is not consistent – as the share of their revenue used in production cost shows. In the case of CNOOC it was 42%, Hess 33% and Esso a mere 12%, which is hardly plausible. This lopsidedness extends into the total expenditure as well: of the combined production expenses of the three entities, CNOOC accounts for 37%, Hess 43% and Esso 20%.
The reverse is true for Depreciation, Depletion and Amortisation (DDA) for which CNOOC incurs 36% of its revenue, but representing 23% of the total on this class of non-cash expenditure incurred by the three companies. For Hess it is 42% and 39% respectively while for Esso it is 31% and 37% respectively. It needs some explaining that Hess would incur a higher cost or charge on DDA than Esso, the much larger partner.
The next two classes of expenditure take some believing. CNOOC incurs just 1% of its revenue and 2% of the total incurred by the three companies on General and administrative expenses. For Hess it is 7% and 17% respectively while for Esso it is 28% and 81% respectively. Esso has two functions under the Petroleum Agreement – as a joint venturer, and as Operator, but it appears that these functions are not only conflated but are confused. It is noted that general and administrative expenses of Esso have moved from $6.982 billion in 2019 to $20.829 billion in 2020, almost treble. The question arises whether this entire sum is incurred in its role as the JV operator, as a separate entity, or as is more likely, both.
CNOOC did not incur any Exploration expenses in 2020 and its financials actually show a credit of $524 million. It is possible that this represents cost recovery but that is pure speculation. On the other hand, exploration expenditure by Hess of $1.361 billion represents 2.3% of its income and 6.7% of the total Exploration expenses incurred by it and Esso in 2020. For Esso, the corresponding percentages are 24% and 93% respectively.
Interest and finance costs incurred by CNOOC were negligible, again with a small credit, while the $520 million incurred by Hess represents 1% of its revenue and 6% of the total finance costs incurred by it and Esso in 2020. And for Esso, it is 10% and 94% respectively. It does need an explanation that interest cost derived from leases would arise out of capital leases which require the lessee taking the asset and the obligations under the lease on its balance sheet. It is this liability which gives rise to interest charge. Typically, as the lease obligations are reduced by payment, such interest costs also reduce but in the context of a giant licensed area and a gold mine of discoveries, this is unlikely to happen for at least another decade as expensive assets are leased under new production licences. These costs would not arise if applicants for production licences did in fact possess the financial resources which the law requires them to have, or if Guyana insisted on thin capitalisation restriction.
Royalty and revenue
The two American Joint Venturers disclose the amount of royalty paid to the Government of Guyana for petroleum produced and sold – CNOOC does not. Royalty paid by Hess was $1.493 billion and by Esso $2.049 billion, a total of $3.542 billion (roughly US$16.9 million), representing respectively 2.52% and 2.72% of sales revenue of the two companies. In early 2021, the Government of Guyana announced that its revenue from royalty for 2020 was US$21.2 million (G$4.410 billion). By deduction, this means that CNOOC paid roughly US$4.3 million (G$903 million), equivalent to 2.2% of its revenue, making the overall average royalty paid by the three companies as 2.5% of sales. The Petroleum Agreement stipulates a royalty rate of 2% which suggests that all the companies are voluntarily paying more royalty than they are contractually required to pay. This raises the question whether the revenue figure of all three entities is in fact understated.
Similar uncertainty arises in relation to the oil companies’ revenue declaration and the Government’s share of profit oil. The Government has announced that the revenue earned in 2020 from its share of profit oil was US$184.9 million. At a rate of US$1 to G$210, this amounts to approximately G$38.9 billion which means that as a share of gross oil revenues Guyana received 18.1% which added to the royalty of 2.5% gives a total return of 20.6%, compared with the 14.25% which everyone, including senior Exxon officials, expected would prevail beyond 2025.
Efforts to obtain clarification of these anomalies have proved futile, again inviting speculation for which there are a number of possibilities. The first is that the companies’ revenue figures do not represent the true value of sales, and that there is undisclosed income. Another is that Guyana may have received what in the industry is referred to as an overlift, meaning that there is an imbalance in its favour in the apportionment of production during 2020, to be evened out in subsequent periods. A single shipment one way or the other can make a huge difference and it is probably safe to say that any overlift would be in Guyana’s favour. While Guyana has disclosed its oil lifts and the revenues per shipment, none of the oil companies presented any such information.
Another possibility is that the oil companies might have deferred some of the precontract recoveries to which they were entitled. This has been a controversial issue since the 2016 Agreement was first made public, and has caused the companies’ numbers being challenged on a number of occasions. A further explanation is that Guyana’s revenue is at full market value while the revenue earned by the oil companies is depressed by inter-company sales.
Taxation
CNOOC and Hess include a taxation charge in their financial statements when in substance, they and Esso are not liable to pay any taxes in Guyana. Their taxes are paid for them by the Government of Guyana but the Guyana Revenue Authority issues them with a Certificate of Taxes paid to enable them to receive a credit in their respective home countries. That appears to be an illicit act disguised as a feature of some old-fashioned production sharing agreement. Esso has chosen not to reflect a credit for what is referred to as deferred tax and one has to wait to see how it will treat taxation when it finally declares a profit in Guyana. Meanwhile, it and its JV partners studiously avoid any clear reference to their tax position under the 2016 Agreement.
Conclusion
Not all the questions raised by the inadequate information presented by the oil companies in their 2020 financial statements are negative to Guyana’s interest. But they are all significant. And they demand proper answers.
All figures are in Guyana Dollars except where otherwise stated.
Next week we will close the mini-series with a look at the balance sheets of the companies.