Introduction
Today’s column continues with a presentation of Envision Research’s modelling of ExxonMobil’s seeming turnaround away from the process of zombification, as I have explained this term. The model under consideration is based on the thesis that, as a long -term Global 500 Corporation, ExxonMobil’s organic growth rate is a function of two variables; namely, the return on its capital employed, ROCE, and the Reinvestment Rate, RR, which is ploughed back into the business. Note: Long-term Growth Rate = ROCE x RR.
The ROCE was examined in last week’ column, and the RR is depicted in the next Section.
ExxonMobil’s Reinvestment Rate
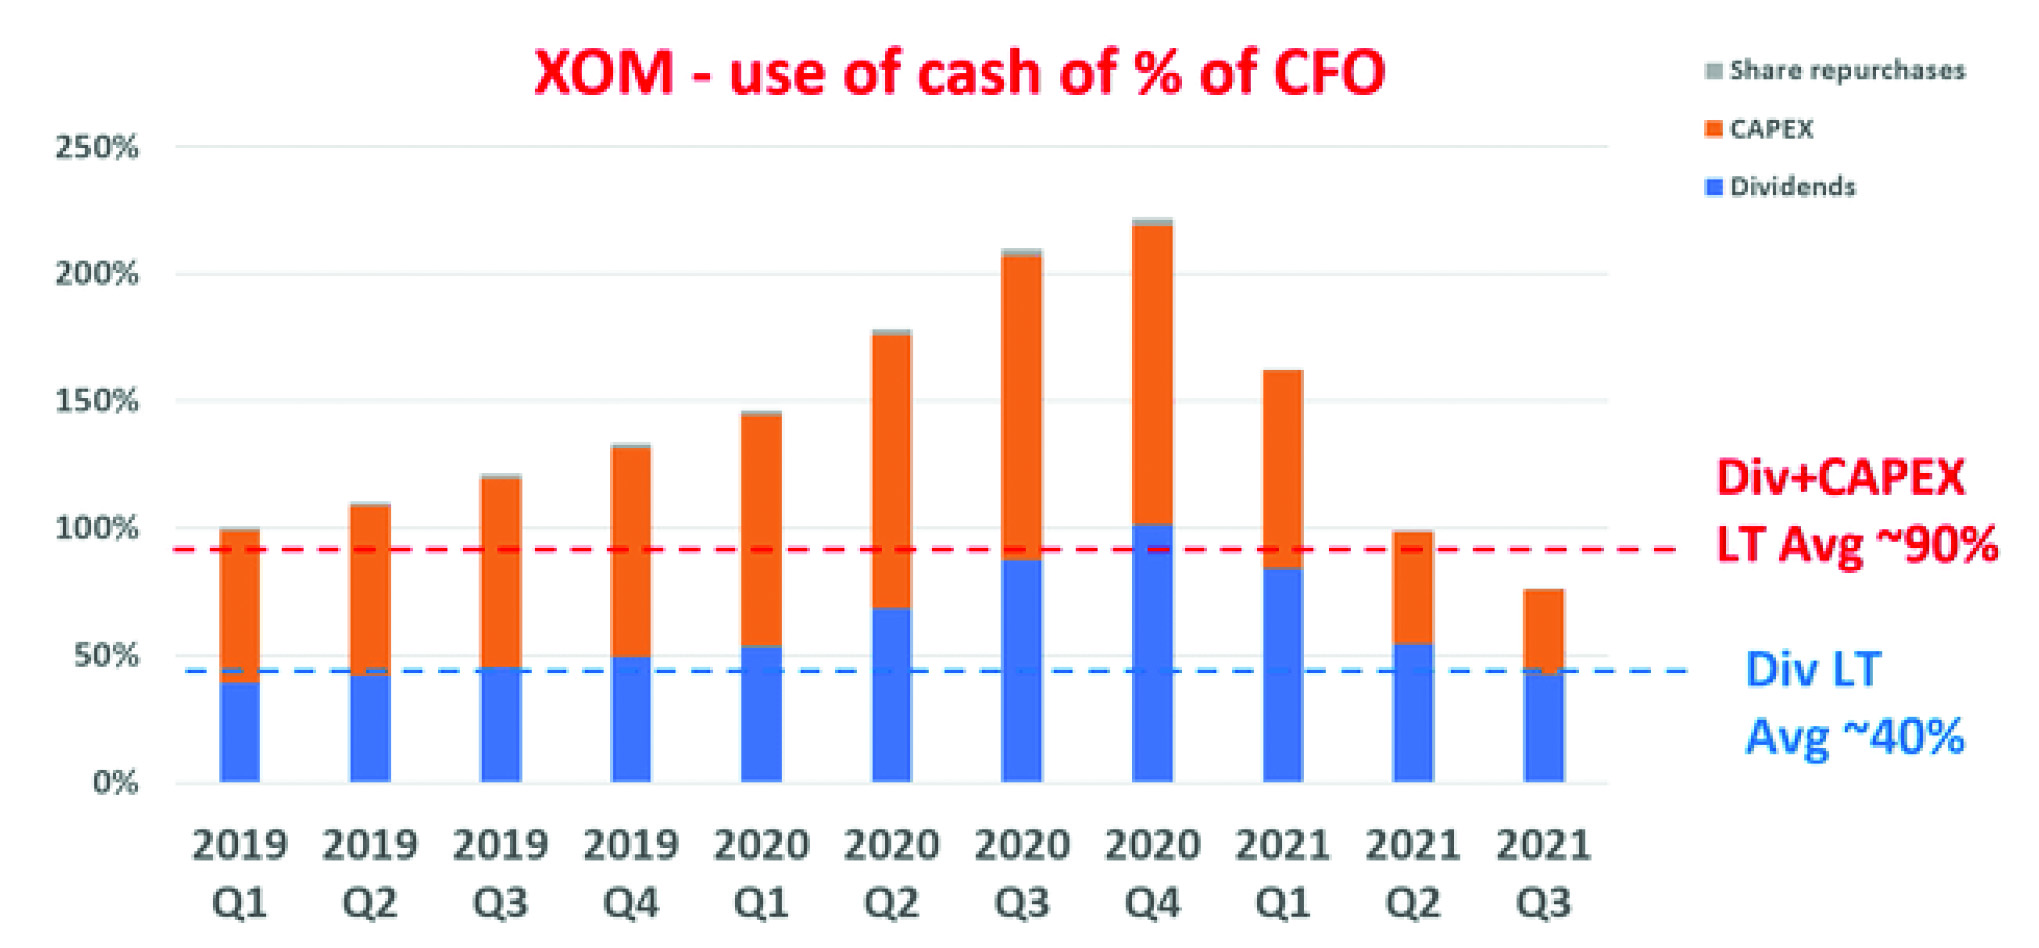
ExxonMobil’s use of cash between Q1 2019 and Q3 2021 as a percentage of its cash from operations [CFO] is revealed in a Chart constructed by Envision Research, which is reproduced below. Like its counterpart shown last week [capital employed], the financial data are calculated from quarterly trailing twelve-month [TTM] financials. The data reveal that the company’s organic investment rate has been almost 0% since Q1 2019. Clearly since then the company has been unable to generate enough operating income to cover its CAPEX and its dividends.
Envision Research has urged that “as profitability recovers …it finally begins to regain some flexibility in capital allocation starting in Q3 of 2021. In the third quarter of 2021, its dividend payment is about 42% of CFO. Therefore, as a result, these two mandatory expenses cost a combined 75% of the CFO. And ExxonMobil can deploy the remainder 25% to fuel organic growth”.
Alternatively, ExxonMobil’s long-term average dividend payment ratio [about 40 percent of CFO.] plus its long-term average CAPEX expenses as a percentage of CFO is about 50% of CFO. Consequently, Envision Research has advised its customers that, as of now, ExxonMobil is well placed in regard to its ability to allocate capital.
 Envision Research based on Seeking Alpha data
As matters now stand, both the determination of ExxonMobil’s ROCE, discussed last week, and its RR, discussed today, are established. Envision Research is therefore in a position to give good stock guidance. The firm is in a position to make projections about ExxonMobil’s long-term growth rate and potential returns. These projections are summarized below. Dividends are assumed to grow at the same rates as earnings, and dividends are not reinvested. There are two projections made. Namely, the bear case, representing a pressured ROCE of 10 percent, and a reinvestment rate of 10 percent as well. This combination yields a long-term organic growth rate of one percent per annum (10% ROCE x 10% reinvestment rate). The other [normal] case has a ROCE of 15 percent and a RR of 15 percent. This yields an annual organic growth rate of 2.5 percent.
Wrap-up
When the above analysis is applied Envision Research arrives at:
1 Earnings per share [EPS] in three to five years = US$ 5.96 Bear Case and US$6.25 = Normal Case.
2 Dividends = US$ 25.58 [Bear Case] and US$27.54 in Normal Case
3 Total Return = Bear Case =18.2% and Normal Case = 68.4%
The research admits there are risks. I share these for readers below
● The biggest one as I can see is the pace and degree of the post-COVID economy recovery. Although the vaccination is progressing extensively and the economy is re-opening at a pace. However, the pandemic is far from over yet and uncertainties like the Delta and Omicron variants still exist.
● XOM’s also faces some interest rate risks, especially in regards to recent hawkish Federal Reserve comments. XOM’s current long-term debt is about $45B, a quite sizable debt burden, especially in absolute terms. A 1% increase in its interest rate would translate into $450M of additional interest expenses. Its TTM operating income is about $13.8B TTM (and $6.34B a year ago). Therefore, the additional interest expenses would be about 4% of its current TTM operating income (or 7% of its last year’s operation income) – a non-negligible impact.
Conclusion and final thoughts
XOM stock price has advanced by more than 30% since Sept 2021. Currently, it’s at the highest level in about two years. However, there are still good reasons to be bullish both in the near term and in the long term. In particular,
● In the near term, as the oil price stays above XOM’s breakeven price (about $45 per barrel), an $80 target price can be conservatively supported.
● As oil prices stabilize and travel recovers after the pandemic, its profitability has turned a corner and demonstrated a perfect V-shaped recovery. The current ROCE is at a very healthy 15.8%. Not only healthy in absolute terms but also higher than its long-term average by 230 basis points.
● Furthermore, the improved cash flow also enables excellent capital allocation flexibility. XOM currently can deploy up to 25% of its operating cash flow to fuel organic growth, far above its long-term historical average 10% reinvestment rate.
● Projected returns are moving closer to the high end of the consensus estimates, leading to a 68% total return in the next three to five years.
Overall the average consensus seems to have underestimated the possibility of oil price hikes as well as the optionality generated by the company’s recent cash generation capability.