Introduction
As part of the revisit of my previous evaluation of publicized modelled calculations of Guyana Government Take ratios, I had observed last week that, just over two years ago [August 2020] the Inter-American Development Bank, IADB, and also much more recently, in August of this year, 2022, Rystad Energy, published modelled calculations of Guyana Government Take along with projections of Guyana Government revenue flows and related operational and investment matters, over a decade and more going forward to 2025-7 and beyond into the 2030s. These results are quite revealing, given that the modelling is based on widely publicized targets set by ExxonMobil and its partners going forward for the Stabroek Block to 2025-2027, and indeed beyond that.
In today’s column I first consider the IADB’s observations in the next section and follow this with Rystad Energy’s observations in the next.
IADB Modellng Economics of Exxon’s first five projects
In my earlier evaluation of the IADB August 2020 Report, carried in this series during Q4, 2020 and Q1, 2021, I had indicated there that as part of its exercise to measure the Guyana Take ratio, the IADB had made public its modelled economics of the ExxonMobil’s publicized “First -five operating wells in the Stabroek Block planned to come on stream by 2025/26” .These projects are:
Liza-1 – US$ 35 estimated breakeven per bbl price. Capacity 120,000 bbls/day
Liza-2 – US$ 25 estimated breakeven per bbl price. Capacity 220,000 bbls/day
Payara – US$ 32 estimated breakeven per bbl price. Capacity220.000 bbls/day
Yellowtail – US$ 29 estimated breakeven per bbl price. Capacity 250,000 bbls/day
Uaru – US$ 28 estimated breakeven price. Capacity 250,000 bbls/day
The modelled IADB’s first five projects listed above reveal the economics data reproduced in Table 1 below. These show data on: 1) the cash flow for the first five planned projects, before the closure/de-commissioning fund; 2) net oil revenues from the five projects; and 3) their overall, as well as individual per barrel production cost.
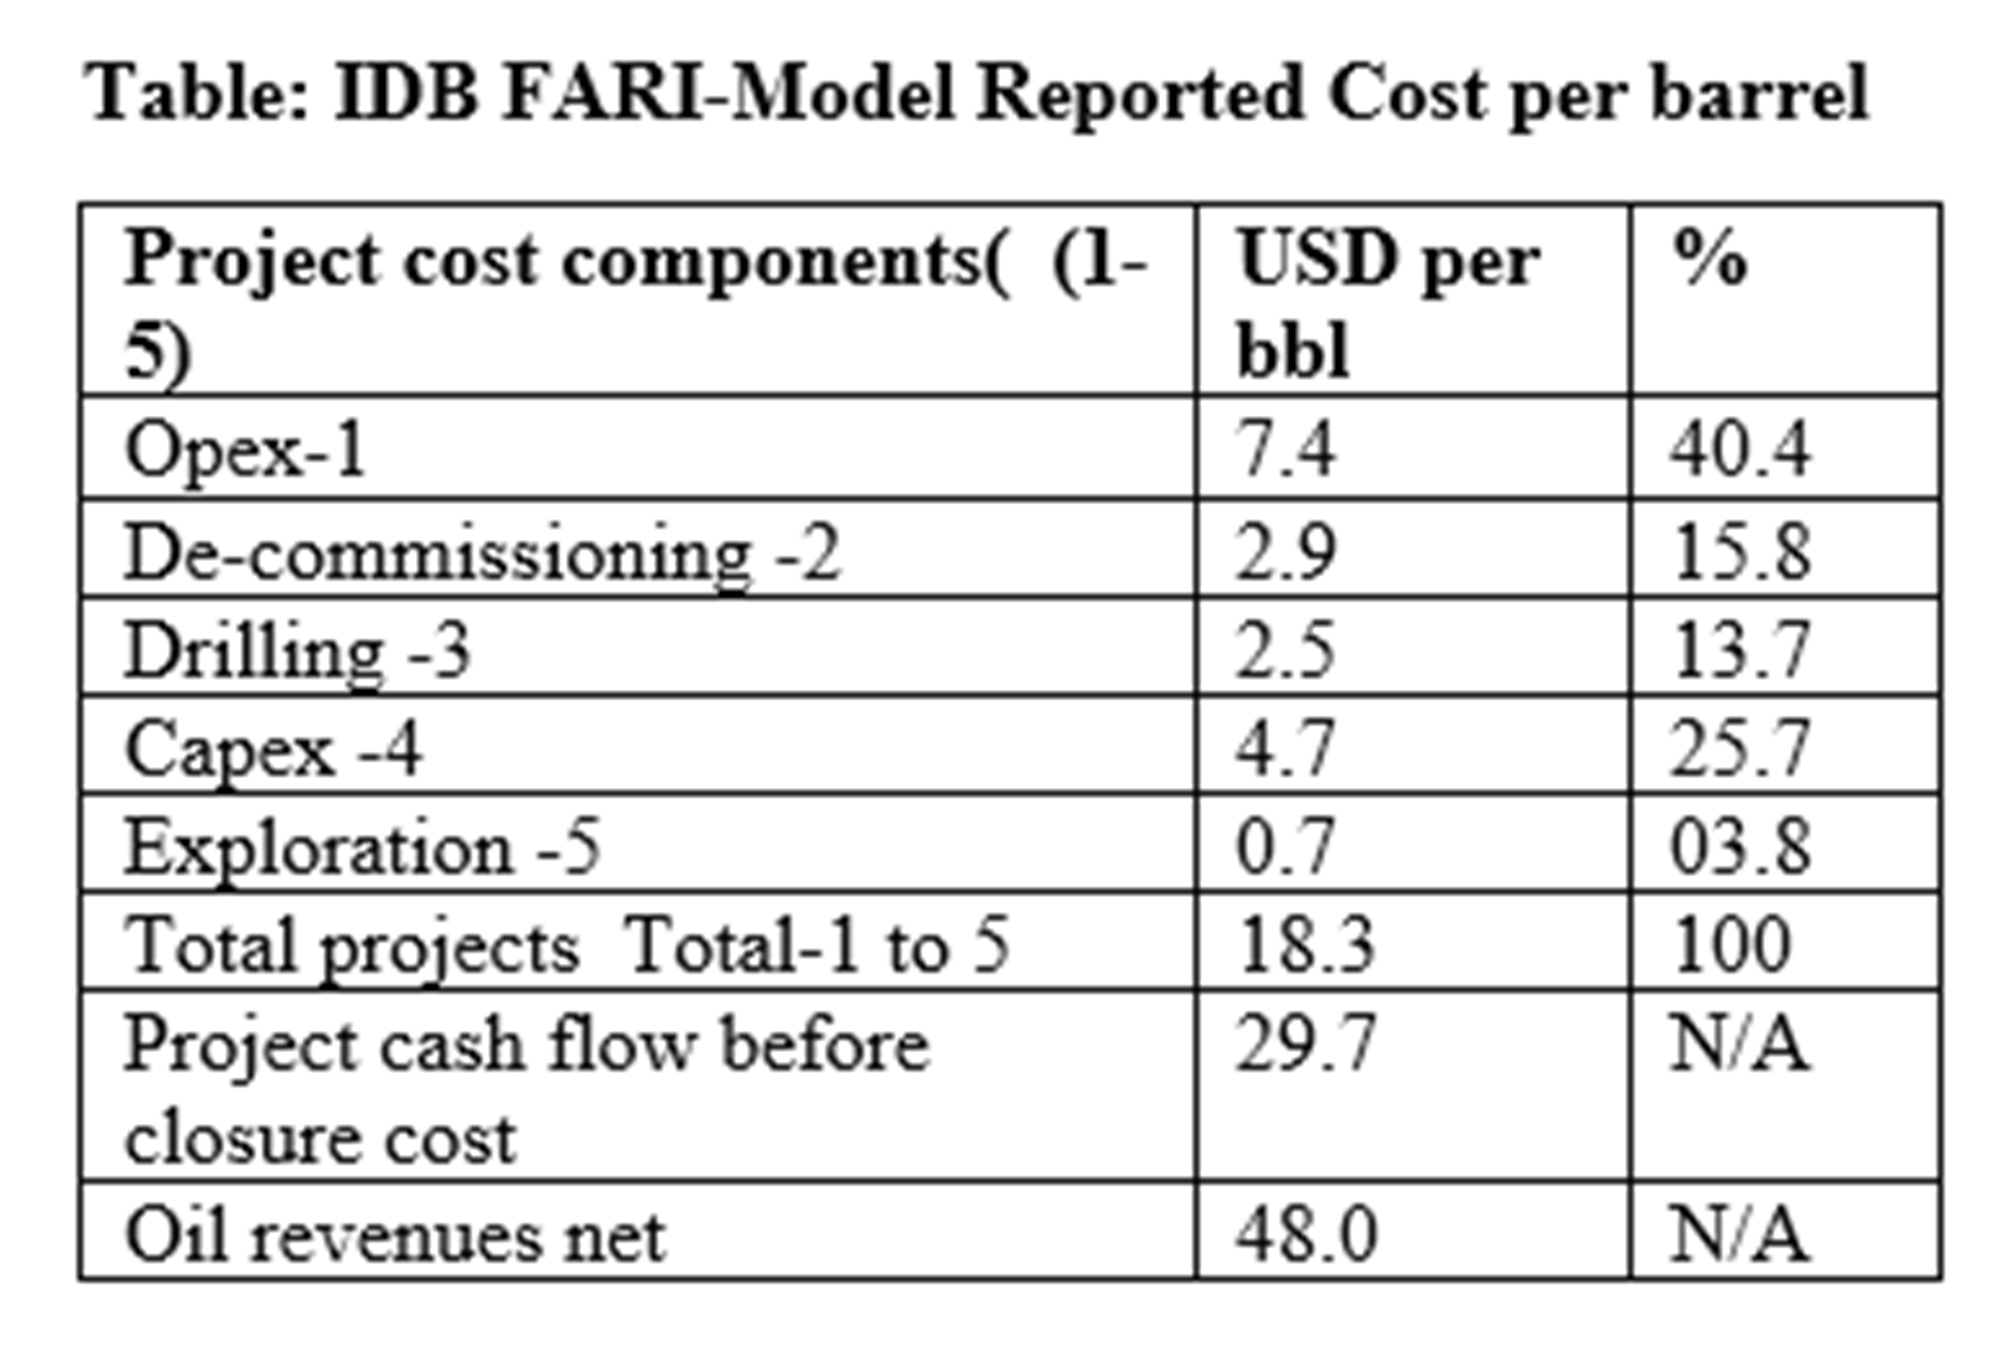 The data reveal that, the item operational expenses, Opex, constitutes the largest single item responsible for the cost of producing a barrel of crude oil on the Stabroek block. Opex refers to ExxonMobil’s day-to-day operational expenses like wages and salaries, rent, utilities, legal and accounting, general and administration, overheads, R&D, and so on. These expenses keep the company operating and account for US$7.4 per barrel of crude oil produced. This represents 40.4 percent of the estimated US$18.3 required to produce one barrel of crude oil in the model.
Capex or capital expenditures at US$4.7 per barrel is the second largest item, accounting for 25.7 percent of the per barrel cost. While opex focuses on the ongoing short-term expenses of the contractor, capex focuses on longer term significant expenditures designed to improve future ExxonMobil performance beyond the current fiscal year. Typically such long- term expenses include property, plant, equipment, and other fixed assets. The emphasis is on longevity; that is designed for use beyond the current fiscal year. Together, the model reveals that opex and capex combined account for about two-thirds of the cost of producing a barrel of crude oil.
To have nearly one-sixth of the cost for producing a barrel of crude oil devoted to a de-commissioning fund belies the noise and nonsense narrative in print and social media concerning Guyana’s un-catered for abandonment of its oil and gas structures when the reservoirs are depleted. Similarly, the narrative of the endless burden of gargantuan exploration debt comes up against the reality that, exploration debt is projected to account for only 70 cents or 3.8 percent of the per barrel cost of producing a barrel of crude oil on the Stabroek block.
Turning to Rystad Energy observations I reproduce these serially in a random order in the next Section.
Rystad Energy Observations [1-3]
Observation 1
In an effort to support its fairly robust finding on the Guyana Government Take ratio of 59 percent in 2022, the firm applied the fiscal rules applicable to the United States, Nigeria, and Brazil to Guyana and these yielded Guyana Government Take ratios of 40 percent, 58 percent and 61 percent, respectively.
Observation 2
Further, based on numerous compounding factors like 1] current offshore discoveries/finds [33 thus far, 2] official estimated recoverable reserves, 3] future likely finds/prospects, 4] geopolitical uncertainties, including the Russia/ Ukraine war; and Guyana’s low emissions crude quality, Rystad Energy speculates that only Saudi Arabia, Brazil, and the United Arab Emirates, will be producing more of such oil annually than Guyana, by 2035!.
Observation 3
The third observation, basically tracks the timeline behind the firm’s published Guyana Government Take results. First, Rystad Energy projects a doubling of Government oil revenues to US$ 1 billion this year compared to 2021; and rising to US$ 7.5 billion by2030 This is facilitated by the low break-evens and the other factors cited in the above paragraph.
Second, ExxonMobil’s original target date for the operation of the first five publicized projects [2025] has Government revenue yield at US$ 4.2 billion. And. after that, a dip in revenue yield follows up to 2027. After that annual revenue peaks at US$ 16 billion in 2036.
Third, cumulative Guyana Government oil revenues up to 2040 total US$ 157 billion.
Conclusion
Next week I continue with this concluding analysis.