Introduction
Today’s column continues my selective reporting on the IDB’s Note, ‘Traversing a Slippery Slope: Guyana’s Oil Opportunity.’ As indicated, I am focusing on two areas of the Note. Firstly, its treatment of the fiscal mechanism enshrined in the emerging hydrocarbons sector, and, secondly, its modeling and measurement of Guyana Government Take (revenues). Today’s column begins with a brief wrap-up of the IDB’s reporting on the fiscal mechanism, which I had introduced in last week’s column. Afterward, I shall begin to address the IDB’s reporting on its modeling and measurement of the Government of Guyana (GoG) Take (revenues).
 Wrap-up
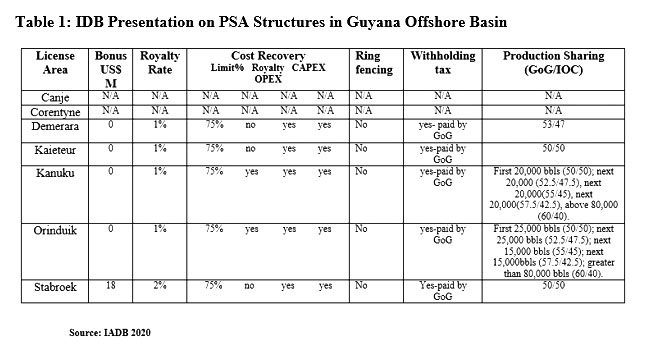
Solely for readers’ convenience, Table 1 above is reproduced in its entirety from the IDB Note (page 13). This table neatly summarizes several key data on Guyana’s PSAs accessible to the IDB at the time. The data reveal that, there are seven licensed areas in Guyana in the order listed here; namely, Canje, Corentyne, Demerara, Kaiteur, Kanuku, Orinduk and Stabroek. Similarly, the table reports on seven structures; namely, licensed areas, bonuses, royalties, cost recovery, ring fencing, withholding taxes, and production sharing. There is no information indicated as available to the IDB for the first two licensed areas, Canje and Corentyne.
Further, only the Stabroek carries a signature bonus. While the royalty rate is 2 percent for Stabroek, it is one percent for the four other areas with information. Cost recovery though is set at a 75 percent maximum for the five licensed areas with available information. To be sure, cost recovery applies to both capital and operational expenditures. There is no ring fencing and the Government pays the contractor’s withholding tax out of profit oil/gas.
Finally, the production sharing between government and the contractor reveals some differentiation. The first two listed license areas have no available information. Stabroek and Kaiteur are 50/50 while Demerara is 53/47. Kanuku and Orinduk use a sliding scale which is positively related to the daily rate of production (DROP).
Table 1: IDB Presentation on PSA Structures in Guyana Offshore Basin Modelling
In this section I start reporting on the IDB’s modeling and estimation of the Guyana government’s likely share of total oil revenues. I begin by carefully specifying the model’s assumptions as these ultimately determine the validity of the results. In what follows, I list five key assumptions cited in the Note and present them in the order given.
Assumptions
As background the Note indicates that the present licensed areas from which they extrapolate into the future have been allocated through bilateral negotiations between government and contractor. Further, these areas are at different stages of exploration, drilling, development and production. At present, ExxonMobil with partners, located on the Stabroek Block, is the only producing contractor from which it can extrapolate production profiles.
Based on this profile, the first assumption is to structure the model around the five commissioned projects in the Stabroek field and their announced combined targeted output of 750,000 barrels of oil equivalent (boe) per day. This is based on the Stabroek field’s estimated recoverable resources of 8+ billion boe, obtained from 16 finds to date.
The second assumption is to exclude natural gas from the model. This is achieved by allocating the gas to improve crude oil recovery as well as to reserve it for yet-to- be- determined future gas -to-shore activities. Third, it is assumed that each project’s production life is 20 years. And, the de-commissioning period for each project is two years.
Fourth, the assumed structure and sequencing of projects to 2025 is as follows: Liza phase 1 ongoing producing @ 120,000 boe per day; Liza phase 2, commencing in 2022 producing @ 220,000 boe per day; Payara commencing 2023 producing @ 220,000 boe per day; Project 4 commencing 2024 producing similar profile as Liza 1 and Project 5 also producing similar profile as Liza 1. All five projects together are to produce 750,000 boe per day.
Fifthly, all five projects are assumed to ramp-up to their full producing capacity immediately and plateau in year 1 of their 20 years life. This is clearly a heroic assumption used for its mathematical convenience. Further, the average decay rate for Liza 1 and projects 4 and 5 after plateauing is 0.62%. And, for Liza 2 and Payara it is 1.71%.
Assumptions on the details of costs, (such as capital and operational expenditures) along with future prices will be indicated in a coming column where I indicate the IDB’s use of the IMF’s Fiscal Analysis of Resource Industries (FARI) model, considered some time ago in this column.
Conclusion
Space remaining in today’s column is not sufficient for me to present a simple schedule that conveniently summarizes the five projects’ sequence described above. I’ll introduce this schedule and indicate the model’s parameters next week before addressing its results.