
Introduction
Thus far, this revisit of the ten individual published estimates of the Guyana Government Take ratios conducted by five separate bodies have highlighted four factors that immediately stand out. These are firstly, the estimates have been provided as owned outcomes of the organizations or groupings publishing these. They include two for-profit businesses [Rystad Energy and Wood McKenzie], one University [West Indies] one social grouping [Open Oil]] and one international organization, Inter-American Development Bank [IADB]. No individual projections were found. Secondly, all five bodies enjoy widely acknowledged reputational and professional standings.
Thirdly, the results cluster in a range of 50 to 60 percent for Government Take, thereby reinforcing the professional standing of the individual sources. Fourthly, based on the Nobel Prize winning theory of incomplete contracts along with numerous uncertainties and unknowns in the Stabroek block then clearly the ruling PSA is an incomplete contract, which is bound to be the subject of continuous negotiated adjustments over time.
I turn in the next session to commence my re-visit of reported Guyana petroleum resources.
Approach
In re-visiting Guyana’s expected recoverable petroleum resource over the very long-term, I refer to two foundational considerations that immediately rise to the fore, both of which I had raised earlier. One of these is the projected status of petroleum liquids and natural gas as sources of global primary energy use over a similar long-term or secular period. And, the other is of course the projected long-term quantity of Guyana’s recoverable oil and gas reserves. This latter will largely determine the output level reached when Guyana achieves full ramp-up of its production and the likely duration of its supply of recoverable resources.
In what follows I draw reader’s attention to the information I possess, on these two separate, but related topics.
For today’s column I focus on the first consideration, which is a summary presentation of the global energy situation over the very long term
Global Long-term Energy Mix
There are several long-term projections of the global energy mix readily available. These range from estimates provided by individual researchers, through estimates offered by energy firms and energy consultancy and related business intelligence firms, to national, regional and international institutional sources. For this column, I have chosen to rely on the United States, Energy Information Administration, EIA, Reference Case projection cited in the EIA’s International Energy Outlook. This models the Reference Case to estimate the world’s energy situation in 2050.
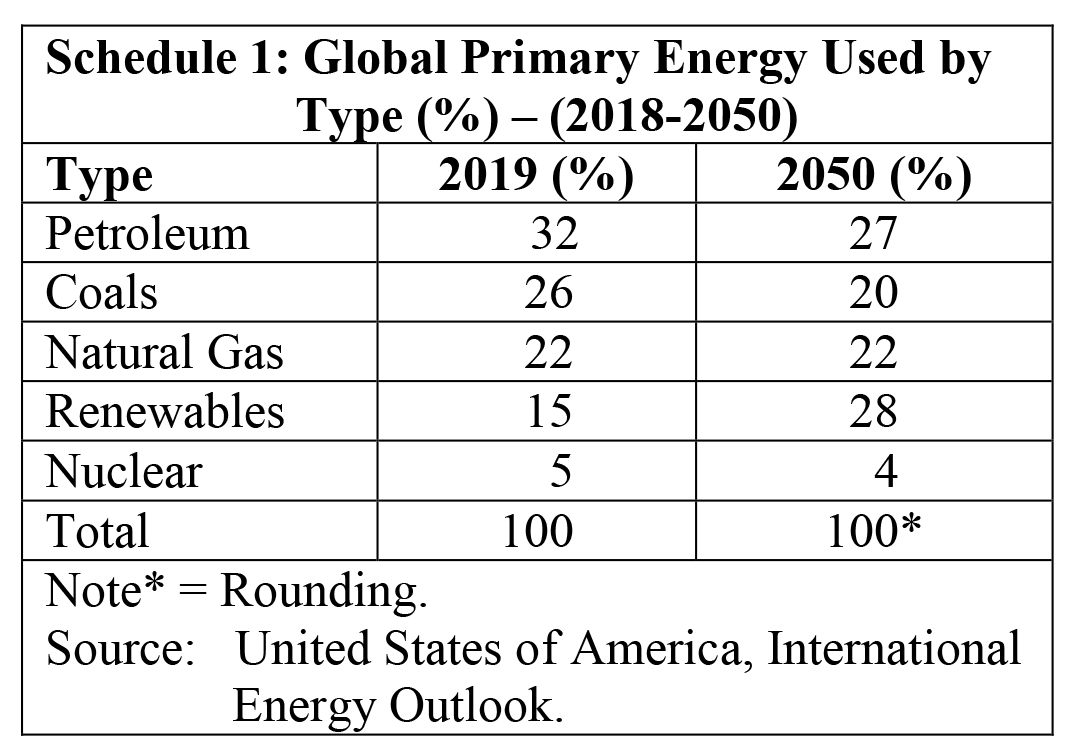
The modelling centers on the standard five modes of primary energy supply; namely, (in descending order of importance) in 2050: renewables, petroleum liquids, natural gas, coal and nuclear. Their projected respective global shares in 2050 are 28 percent, 27 percent, 22 percent 20 percent and 4 percent. Over the period, the most striking occurrences exhibited in the projections are that: 1) petroleum liquids lost the pre -eminence it held in 2019, the year of Guyana’s First Oil (32 percent); and in fact declined as a share of global primary energy supplies; 2) the share of renewables rose from 15 to 28 percent; 3) the share of natural gas remained constant over the period, at 22 percent; 4) coal’s share fell the most, from 26 to 20 percent; and, finally, 5) nuclear power’s share declined from 5 to 4 percent, while remaining overall still only a marginal source.
In summary, the fastest growing energy source projected by EIA over the period, 2019-50 is renewables at 3 percent per annum. Natural gas is projected to grow by 1.1 percent and liquid petroleum by 0.8 percent per annum over the period. These data are summarized in Schedule 1.
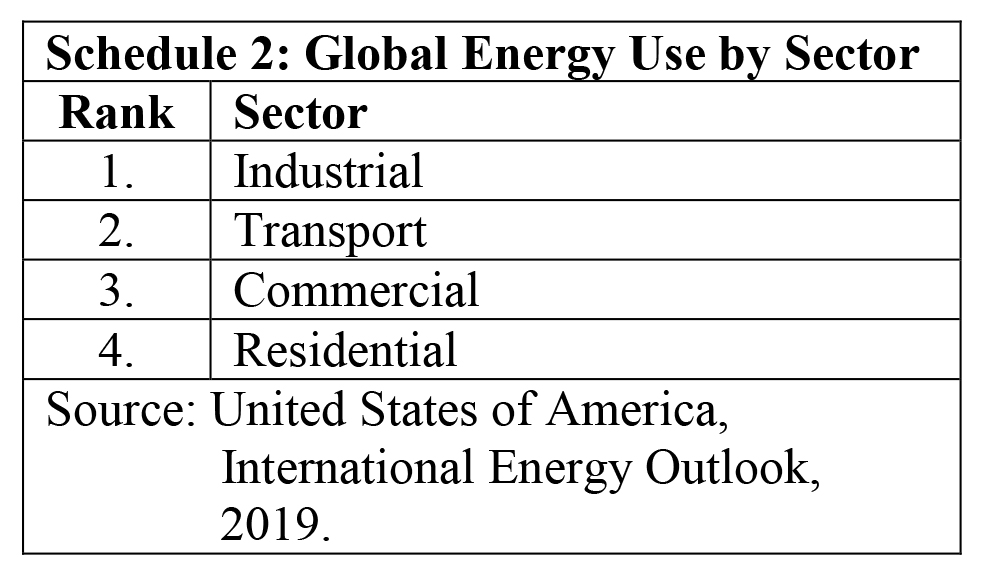
The EIA model identifies the leading primary energy consuming sectors as industrial, transportation, commercial, and residential. Here, industry includes manufacturing, refining, construction, and agriculture. This sector accounts for more than half of projected energy use in 2050. Schedule 2 summarizes these data.
The EIA classifies the world into two broad groupings; namely, the 38-member Organization for Economic Cooperation and Development, OECD, and the others; that is, non-OECD. The latter grouping is further sub-divided into six geographical areas: Asia, Middle East, Africa, Americas, Europe and Eurasia.
Looking into the future there clearly will be an inflection point for global crude oil production on/or before 2050. This is captured at the point when liquid petroleum loses its pre-eminence as a primary energy supplier. An important caveat, however, must be introduced. Despite liquid petroleum’s reduced share by 2050, between now and then global demand for this item is indeed projected to increase by a whopping 30 percent! This means that today, the existential threat to Guyana’s infant oil and gas sector still remains a secular prospect. This is a key outcome for my appraisal of the probable impact of the 2020 general crisis on that sector.
Conclusion
I continue this discussion next week.