Introduction
Last week’s column concluded my presentation on the Buxton Proposal. This is the last of the topics identified in the final Part (2) of Guyana’s Petroleum Road Map. Based on several readers’ queries, I believe that, it would be useful if I provided a summary of the petroleum metrics that was earlier introduced, when presenting the Road Map. This summary offers some useful insight into the affordability of the Buxton Proposal.
The detailed petroleum metrics that I had previously introduced, centre on three critical relations. First, there is my projected value of earnings from Guyana petroleum sales. This value is dependent on 1) its projected petroleum reserves 2) its expected daily rate of production, DROP expressed in barrels of oil equivalent, boe, and 3) the price at which each boe is sold.
Secondly, the projected overall profit derived from petroleum sales. Projected total profit obtained on each boe sold, is a function of the volume of sales; the price of each boe; and, the cost of production incurred in producing each boe.
Thirdly, how much of the profit obtained from each boe is expected to flow to the Government of Guyana, GoG? As used in this series, this share of the profit is termed the Government Take. This Take is determined by the terms of the various applicable Production Sharing Agreements, PSAs, governing companies’ allocated successful Guyana oil blocks.
Approach
Going forward, I shall summarize these three relations in the order indicated above. However, I need first to make a few observations. First, I shall present simple Schedules to elaborate these relations and my projections. Second, unless otherwise stated, my projections are based on the “full ramp-up”, level of oil and gas production, as listed below. Third, Rystad Energy has modelled Guyana’s petroleum metrics/revenues; as revealed before in the Road Map. The relevant information from that model is restated, at appropriate stages below. Fourth, I have applied my values to compare with the Rystad Energy model. As to be expected, these values yield different outcomes.
Relation 1: Guyana DROP
There are various projections of Guyana’s oil and gas reserves. I have been “strongly bullish” on this indicator; in contrast to my “conservative estimation” of Government Take. Here I recall the ridiculously low estimates, (one to two billion barrels of oil), posted in the media following the Liza discovery in May 2015. However, I have projected from the outset, in the Road Map, Guyana’s potential petroleum reserves at 13-15 billion barrels of oil equivalent, boe.
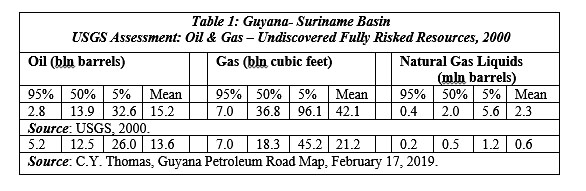
As previously indicated, my rationale for this estimation, is founded on two considerations. One is the “mirror image theory” of oil concentration in the physical areas where, over geological time, the continents of Africa and Southern America, previously joined together as one land mass, separated into two distinct continents. The other consideration is the result of two United States Geological Survey’s, (USGS) assessments of undiscovered fully risked oil and gas resources in the Guyana-Suriname Basin. The USGS results are summarized in Table 1 below.
 Source: C.Y. Thomas, Guyana Petroleum Road Map, February 17, 2019.
For the next step of the analysis; I then compared Guyana’s potential reserves against proven national petroleum reserves estimates, as reported and ranked globally (Wikipedia). This ranking indicates that countries with similar proven reserve volumes to Guyana’s potential, produce between 1.5 and 2.5 million boe, (mboe), per day. I have therefore concluded from this that, at full ramp-up, Guyana’s DROP will fall within this revealed range. As we shall observe, for purposes of calculating the petroleum metrics, I have utilized both the lower and higher range level. These provide a DROP between 1.5 and 2.5 mboe per day. This range provides my projected Guyana’s petroleum output, and consequently earnings potential for Guyana, at full ramp-up, based on the expected Guyana crude oil market price.
Price
Following on this, I have projected Guyana’s crude oil price at US$70 per boe, at the time of full ramp-up. Rystad Energy’s model for Guyana crude, uses a price of US$75 per boe, at full ramp-up output (all prices are nominal). How my US$70 per boe estimate compares to prices over the past decade, is revealed in Table 2.

Based on my projected price, annual earnings for a DROP of 1.5 mboe per day yields US$35 billion and at 2.5 mboe, US$60 billion.
Government Take
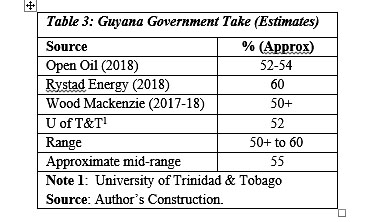
Expected Government Take, based on the template of Guyana’s PSA with Exxon, has been previously estimated by Open Oil 2018, Rystad Energy, 2018, Wood Mackenzie, 2017-18, and the University of Trinidad and Tobago. These ratios are shown in Table 3. There I indicate the range in the estimates, and utilize the mid-range as the Government Take ratio that I apply for my estimation. This information is shown in Table 3.
Conclusion
The above sums up how I arrive at the first relation, expressed in the petroleum metrics, which is: how to estimate projected petroleum earnings, and the rate of Government Take (revenues) yielded by petroleum sales. As noted, all values are nominal, when applied to the future “full ramp-up” production level?
I continue next week, with the second and third relation.