Introduction
Last week’s column had advanced the proposition that downward revisions to the IMF, Q4, 2019 forecasted growth rate, provide a rough proxy indicator of the economic cost of the setbacks and reverses which will occur during this year, as the 2020 general crisis unfolds. The downward revisions so far, are provided by the IMF itself, along with the World Bank, the United Nations Economic Commission for Latin America and the Caribbean (UNECLAC), and NASDAQ. As revealed last week these downward revisions of Guyana’s projected 2020 growth rate range from 40 to 60% of the original IMF Authorities rate of 85.6%. This is a macroeconomic indicator, which I was careful to stress will not go unchallenged. Therefore, I begin today’s column by providing the rationale for my choice of indicator (GDP).
Rationale for Proxy Indicator
The main challenge to the proxy indicator is likely to be its use of the GDP. The summary definition of the GDP that I provided last week is the one put out by the World Economic Outlook (and used by the IMF) to define GDP for the general readership of its documents. To my mind, although it is difficult to reduce to a single construct, the innumerable transactions, activities or incomes generated in any economy, this measure is now universally accepted as the best. Further, it is calculated using globally accepted methodology (the United Nations System of National Accounts), to produce standard results, which can be used to compare across countries. As a consequence, Investopedia claims the GDP is, “despite limitations, a key tool to guide policy makers, investors, or strategic decision-making … It is a comprehensive scorecard of the economic health of a country for a given period.” This is a powerful endorsement.
Having pointed out the above, I do not deny that the GDP as a measure has been frequently, challenged. So far, however, no challenge has come even close to replacing its use as a universally accepted economic measure.
For readers’ benefit, I list here four limitations of the GDP, which together make the concept less than perfect. These are: 1) It focuses on measuring only those transactions that take place in markets. Consequently, it excludes unpaid labour (like household help), or informal activities outside of formal markets; 2) It does not measure data on jobs and unemployment generated by the GDP, although it covers investment; 3) It measures overall income but not the manner in which that income is internally distributed. In other words, who gains and who loses as GDP is produced; and 4) it does not speak to the sustainability of the growth rate.
Although the original Q4, 2019 IMF forecast for 2020 was as high as 85.6%, for the following year 2021, the projected rate was 4.8%. Table 1 below reveals, Guyana’s actual GDP growth rate for the period 2014 to 2019. This information is based on 2012 prices. Noteworthy, this rate has varied from 2.6% in 2017 to more than twice that, 5.4%, in 2019.
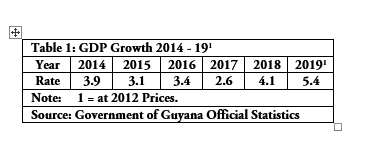 To recall, Guyana’s First Oil started in late December 2019, and the first shipment of oil took place in Q1, 2020. The more robust growth rate of 2019 revealed above, was due to income (GDP) generated by pre start-up expenditures of ExxonMobil, the lead Contractor.
At this point, I shall leave, for now, further discussion of updated changes to Guyana’s GDP growth rates during 2020, as a measure of the 2020 setbacks occasioned by the unfolding 2020 general crisis. The focus so far has been on appraising impacts at a macroeconomic level. Going forward, I focus on particular sectors using a microeconomic approach this time. I start with observing the impact on Guyana’s crude oil prices.
Price Behaviour
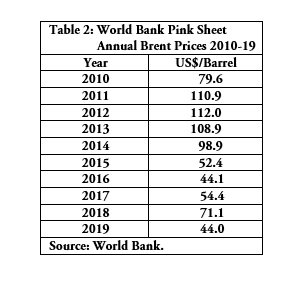
I must remind readers of the high variability of crude oil prices during the decade of the 2010s. Over that period, the Brent Crude price per barrel has ranged from US$44 last year (2019), to a peak of US$112 per barrel in 2012. (See Table 2) The average price over the first half of the 2010s decade was about US$96 per barrel, while for the second half, it was much lower, US$53 per barrel.
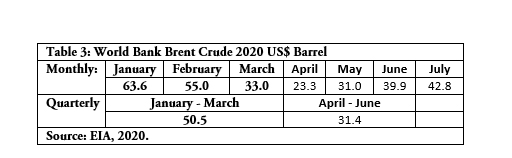
Brent crude oil price movements so far during 2020 shows the effect of the general crisis. The January 2020 price was US$63.6 per barrel. This fell dramatically low to US$23.3 per barrel in April 2020. Since April, the price has risen progressively to a high of US$42.8 in July. The average price for Q1, 2020 was US$50.5 per barrel; falling to US$31.4 per barrel for Q2, 2020. (See Table 3)
US Energy Information Administration, EIA, shows actual (Q1 and Q2) Brent crude prices, as well as projected Q3 and Q4 Brent crude prices. These data are shown in Table 4. They support the indications noted in the previous paragraph.
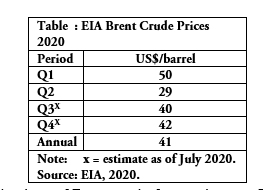
These data focus on the behaviour of Brent crude for good cause. It is reported that the price of Guyana’s crude is fixed in the market at a range of US$1.50 to US$2.0 discount per barrel of “dated Brent”. For readers’ information, dated Brent is the price paid for “physical cargoes of crude in the North Sea that have been assigned specific delivery dates”.
Conclusion
Next week, I begin by revealing the actual prices obtained by Guyana for its oil sales. Following that, I continue the microeconomic appraisal of the economic impacts/reverses, following shocks to Guyana’s infant oil and gas sector, precipitated by the 2020 global general crisis.